Category Archives: Graphic Facilitation

Curiosity blog raises curious conundrum

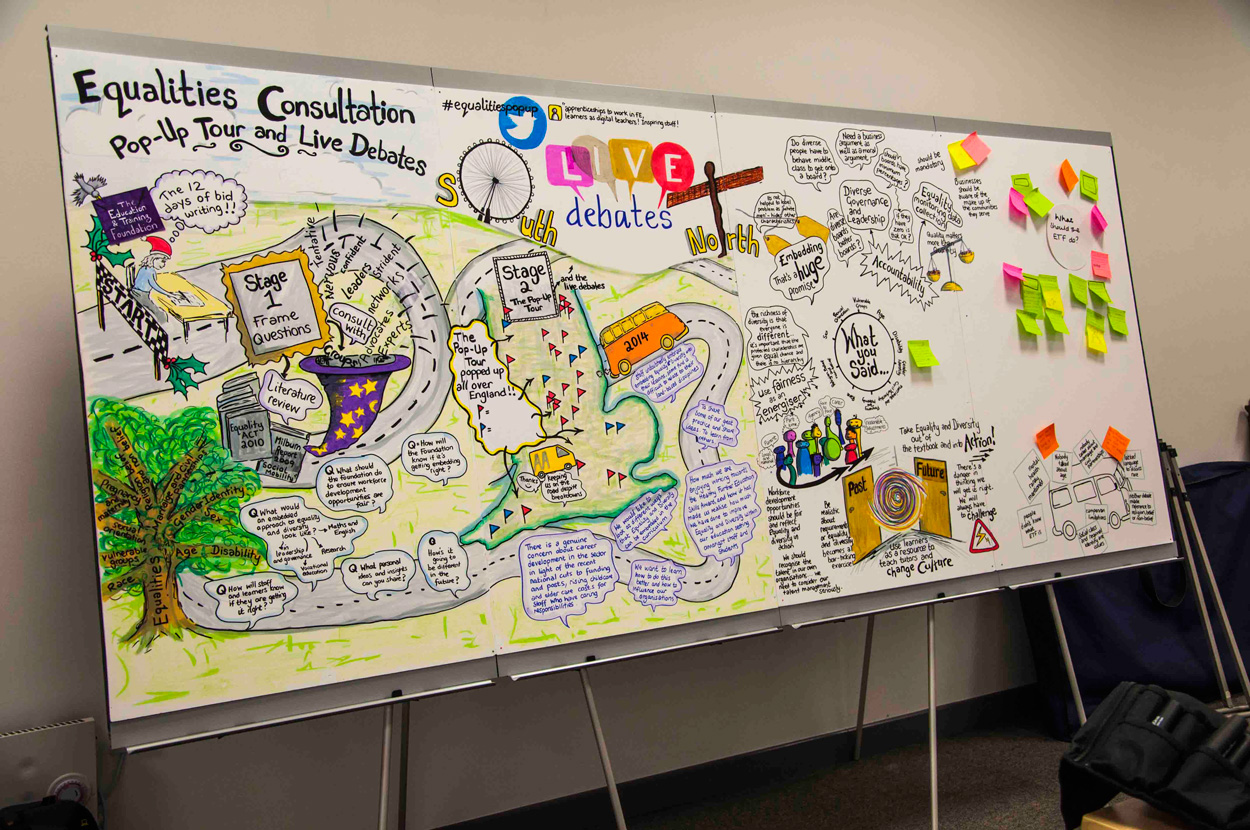
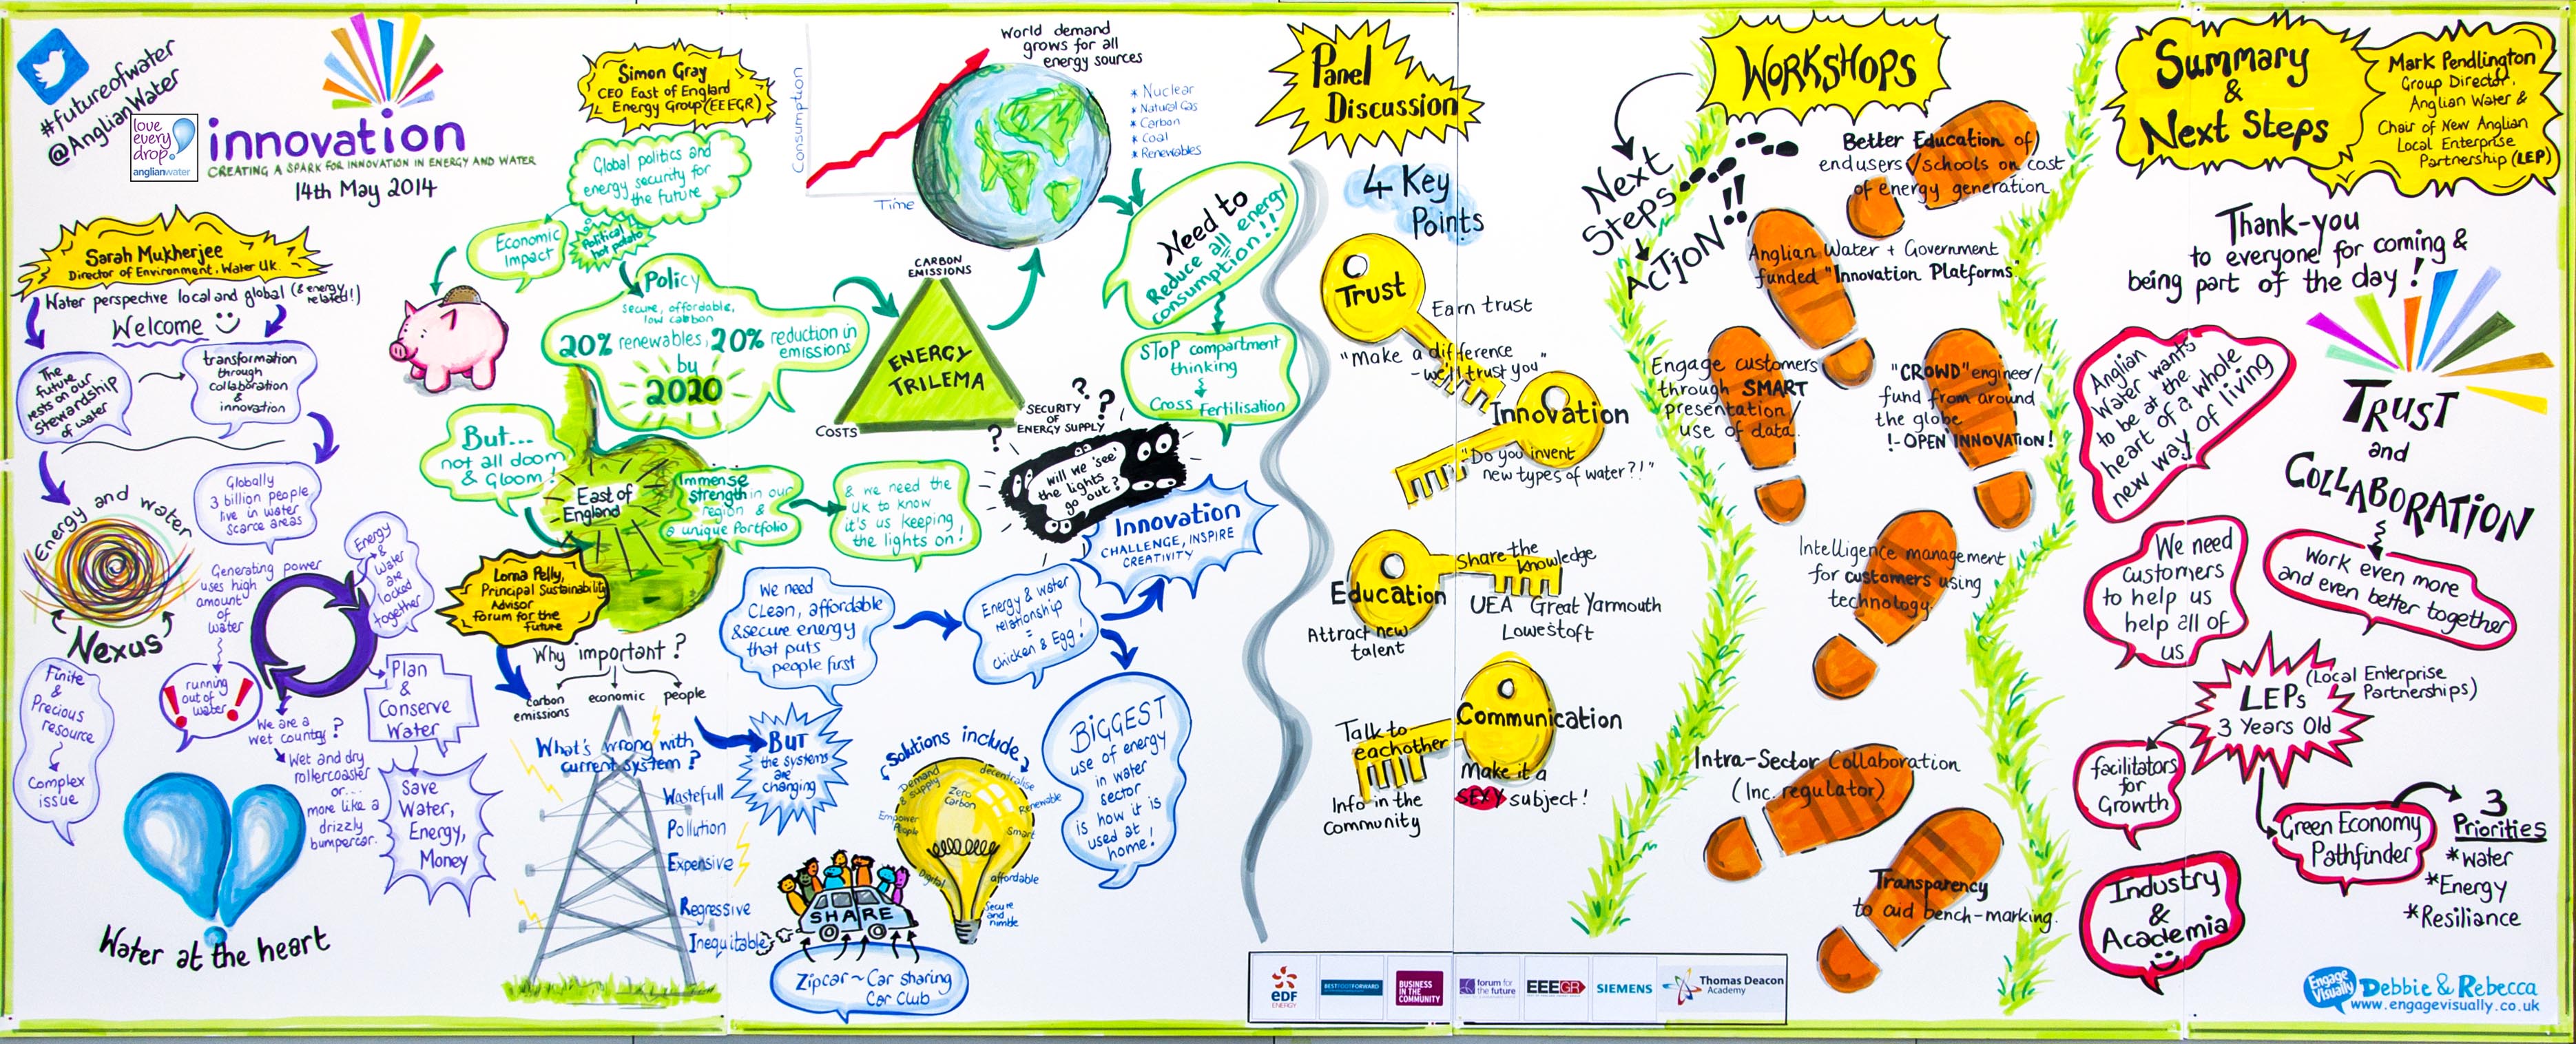
Here’s my latest conundrum, a conundrum that emerged as I creating this recent graphic recording…. I was left pondering as I came to the end of the piece what do I refer to it as? In reality, this is the same pondering thought that surrounds how people refer to graphic recording and graphic facilitation more generally.

CURIOSITY-EV

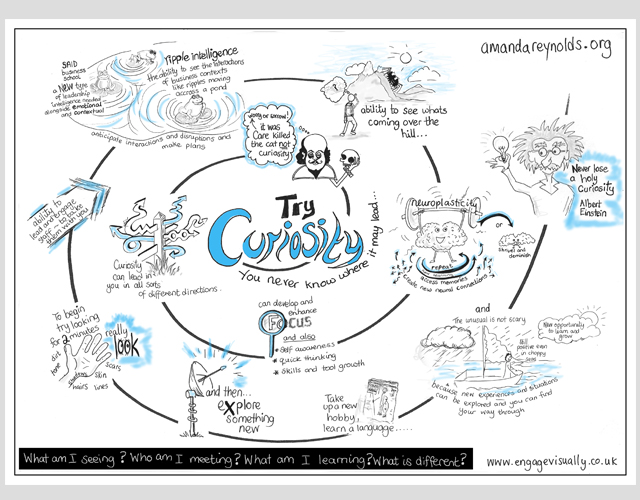
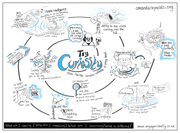
This word and semantic conundrum came into focus when presented with a series of leadership blogs by Amanda Reynolds of Blend Associates (http://amandareynolds.org). Amanda wanted an image, a graphic, a graphic narrative that graphically records her leadership blog. Amanda wanted her readers to be able to a large extent to access the essence of the blog through a stand alone graphic or to read the graphic in a complementary way alongside the blog. Fortuitously Amanda’s latest blog on leadership was all about curiosity (https://blendassociates.wordpress.com/2015/02/28/can-you-be-a-great-leader-try-curiosity/). And with good curiosity I began to explore the language people are using for graphic facilitation and graphic recording, within a relatively short while I had come across this not insubstantial list;

  • Archi-toons
  • Architecturally oriented visual explanation
  • Artifacts
  • ‪Artwork
  • Big Map
  • Captures
  • Charts
  • Drawings
  • Graphic Facilitation
  • Graphic recording
  • Graphic harvest
  • Illustration
  • Infoharvest
  • Flow
  • Mindmap
  • Mapping
  • Maps
  • Model
  • ‪Murals
  • Notes
  • Pictures
  • Rich Pictures
  • Sketch notes (not usually large scale but created live)
  • Storyboards of their day
  • The big paper
  • The recording
  • Visuals,
  • visual documentations
  • Visual harvest
  • Visual maps
  • Visual minutes
  • Visual notes
  • Visual reporting
  • Visual storytelling
  • Visual summaries
  • Visual templates
  • Visuals

So having gathered this ever growing list my curiosity leads me to recognise I need to continue to listen and explore the language and words people use and the contexts they are using them in and see where this leads me. And whilst I recognise how words and semantics can be all powerful what ultimately is being done in the work is to use visual communication tools to support people in their various endeavours. Therefore if these visual communication tools are supporting peoples processes and capturing and conveying meaning then they achieve their purpose whatever you call it.

If you’d like to tell me what you would call this piece on curiosity I’d love to hear your views.

_______________________

You can find the Leadership blogs by Amanda Reynolds of Blend Associates at; http://amandareynolds.org and Amanda’s Leadership blog on Curiosity can be found at; https://blendassociates.wordpress.com/2015/02/28/can-you-be-a-great-leader-try-curiosity/

Visual Thinking -NHS England Liaison & Diversion Operating Model

The NHS England Liaison & Diversion Operating Model aims to meet the needs of people coming into contact with the criminal justice system. This model is being piloted across the country with the intention to enable people to get the support they need. It doesn’t give people a get out of jail free card but it does aim to ensure that underlying needs and rights are met and to provide people with an equal chance of avoiding the criminal justice system or being supported fully once they are in it.

Revolving Doors Agency asked for a visual representation of the Model to use as a discussion tool with people so they could explore where it is working, where it doesn’t, what is missing and peoples experience of the various parts.

Visual thinking is being used increasingly in health and social care, in education and in business to support conversations, to join up the dots and to make the bigger picture more visible to more people.

Drawing out ‘What is it you do?’

The work of a graphic facilitator is not always easy to explain because there are so many potential ways of working. The landscape is populated with almost endless possibilities, many of which are waiting for the next conundrum that needs solving.

A recent piece of work shows one of these potentials, a graphic record was developed live over a number of different events, a section at a time and then compiled creating a 7.5m graphic record that colourfully captured many conversations centred on a pivotal consultation.

The Education and Training Foundation (The Foundation) was entering an important consultation because they had recently been gifted The Professional Membership Service for those working in the Further Education Sector. In receiving this gift and legacy they needed to look forward, talk and listen to existing and potential members and shape the future of the Membership Service they would be offering and supporting. At Engage Visually we went to a number of sector based events with The Foundation to host conversations and to work on the consultation about the service. As we listened we captured key concepts, ideas and issues and added these to the graphic recordings. At each event, a fresh picture emerged and as the picture emerged it would create a focal point of interest. The graphic records would draw people in and they would come across to ‘see’ what was happening; in turn, they would often become involved in the discussions themselves. A number of The Foundation’s staff were involved alongside the graphic facilitator, talking, listening and shaping the graphic recording. The lead for the consultation work at The Foundation, Claire Mitchell, Head of New Business-Programmes and Services, shaped the visual metaphor of the process of a river running through the landscape with different tributaries flowing in and out.

Graphic facilitation was one method The Foundation used in the overall consultation, with the aim of engaging people in a dynamic conversation and at the same time creating material that would support further engagement as the process unfolded.

This work with The Foundation was a customised service and whilst there a number of ‘off the peg’ services that will fit many people’s needs we also know that some organisations’ needs will start with a conversation. The conversation will then create and build solutions, solutions that will always be doable, exciting and most importantly, useful.

2


141211-ALL-GRAPHIC-RECORDS-combined


A sketch note is good for the soul and mind

So the virtues of visual methods to engage people meaningfully and creatively are being endorsed more and more. This includes graphic facilitation, graphic recording, visual notes, scribing to name a few. All of which is great for the revolution of visual thinking and engaging people effectively. But where did and does it all begin? For me, quite simply, like for many, it began in many meetings where for my own sake I was trying to make sense of what I was hearing and aiming to capture key points to help my memory process and retain the nuggets of information.

I soon found the notes were becoming not only purposeful and useful but a great freedom and creativity within what was often an otherwise constrained environment. Many years on I still find myself totally absorbed by the content and fully connected with the pen when I sketch note purely. This sketch note was a response to a short animation from Matt Greenwood’s 50sec animation-24 design elements


Graphic Facilitation of Equalities Pop-Up Tour

A short update to the post below to say the graphic is now complete 🙂 The graphic record is designed to describe the Equalities Consultation, Pop up tour and live debates which explored equality and diversity in continuing adult education.

Tour & Live debates. Graphic. Final mediumquality

____________________________________

What a different and creative way to use Graphic Recording. Not so long ago I was approached by the driving force behind an innovative consultation about equalities in adult education, Catina Barrett, Programme Manager, National Institute for Adult Continuing Education (NIACE). She described how they had talked to people the length and breadth of England, popping up literally in a camper van to meet and talk to people! They also held debates that were streamed live for wider audiences. The request was to have the methods and findings of their work translated and distilled down into an engaging Graphic Recording. The process was very interactive with the researchers working with the facilitator and the content placing, shaping, replacing information until the picture emerged that reflected the work. The image is almost complete and they plan to use it to convey the work and the findings. They hope to use it to create and hold attention to the areas people have highlighted and the actions that are recommended as a result.

2sfw

Green Britain Centre – Water and Energy

Last week was the first event in a series Anglian Water are delivering to have innovation conversations. The first focused on Energy and Water and below is the live Graphic Recording from this event. It is going to be interesting to being part of the events unfold and to create the Graphic Records that aim to build the memory and a connectivity across the events. The Graphic captures will support the stream of consciousness and the ideas that stem from the conversations, watch this space for the developing picture 🙂

140514.Energy&Water.Full Graphic Record.Small

Making more use and sense of our notes

How often have you spent hours of your life in meetings or training and written reams of notes that you have never referred to again? I used to. But then as doodling had always been a tool to help me focus and concentrate my notes gradually transformed into more purposeful notes with doodles i.e. ‘sketch notes’. In time this has led to an entire professional way of life which I’m not suggesting is everyone’s cup of tea, however, this article is nice illumination of how we can all transform a page of endless writing into a quick visual evocation of the main points and bring us back to the content in moments. Read the full article here Making more sense of our notes

Engaging visually really does make a difference.

Below is a link to a great article that is stimulating, engaging, informative and informed about why visual content is sweeping the modern world. It is a great piece about how the emerging wealth of methods are not purely here to be pretty/beautiful or trendy though some of them may be there too. This article provides evidence for how and why visual methods engage, how they help us to connect and make connections. By citing evidence to support the claims for the helpfulness of visual methods is refreshing. Thank you to NeoMam Studios for your work 🙂

http://neomam.com/interactive/13reasons/

Graphic Facilitation & Graphic Recording supporting the 5 Core Skills of innovation

5 core skills of innovators

We are increasingly finding many uses for Graphic Facilitation and Graphic Recording in supporting people and organisations to problem-solve, innovate, create and find solutions. The following article sheds some gems of insight around key components/characteristics that foster these mindsets and was found through the website link below;

http://stanfordbusiness.tumblr.com/post/51889767187/5-core-skills-of-disruptive-visual-thinking-innovators

“Visual thinking is the foundation for being creative and solving some of the most complex problems,” explained author and founder of Innovation Studio Lisa Kay Solomon. Solomon and Emily Shepard of The Graphic Distillery discussed the key role of visual thinking in innovation at a recent Stanford GSB Mastery in Communication Initiative talk. Below, they share five visual-thinking based skills that disruptive innovators must master:

1) Observe
Set your phone down and actually pay attention to what’s going on around you. You can’t come up with new ideas unless you observe the world with fresh, empathetic eyes. Keep a design journal and document what you observe at least once a week.

2) Question
Once you have a look around, review your design journal and ask: “What’s going on here?” Questions allow for space in the brain. If you’re not curious about something, then there’s nowhere for your observations to go. As an innovator, you should ask questions to nail down the problem you’re trying to solve.

3) Associate
Combining ideas lead to new insights. In the book Where Good Ideas Come From, author Steven Johnson proposes that innovation comes from places where half-baked ideas can bump up against other half-baked ideas and together create something even better. Doodling is a way to cultivate these seeds of ideas.

4) Experiment
Visualization makes your ideas tangible and concrete. “If you can’t draw your ideas in stick figures, you don’t know what you’re saying,” says Solomon. Drawing by hand is a method of prototyping that allows you to test out the core essence of your idea in a low-res way before you spend more time on it.

5) Network
Get access to people in diverse universes to expand your opportunities and areas of expertise. What are some big areas missing from your knowledge bank? We often end up just having a deep network of people like us instead of a diverse network.

For more insights on visual thinking, follow #GSBVT on Twitter: http://stnfd.biz/liMyC