The International Forum of Visual Practitioners (IFVP) Annual Conference 2015, Austin, Texas
In July I travelled to Austin, Texas to join the 20th Annual conference of the International Forum of Visual Practitioners (IFVP) where around 150 people from across the world from twenty-one different countries involved in the various forms of visual practice came together aiming to explore the potentials of the work. Visual practice includes people involved in graphic facilitation, graphic recording, sketch noting and graphic coaching to name a few of the strands.
I have been a member of the IFVP for the last three years and felt very honoured to receive one of the six scholarships that the IFVP gives to members each year. Here I hope to share a few of the key highlights and learning gained from travelling so far to join in. I arrived at Austin’s Bergstrom airport on Monday evening to a wave of Texan heat, an array of very different bird song (mostly the Great Tailed Grackle I was told) and strong American accents surrounding me. I caught a bus to the conference hotel as I was in no rush and let my eyes explore as I travelled the short journey into the city of Austin.
Early the following morning, I went to seek out Lynn Carruthers, the then President of the IFVP and the person leading the organisation of the conference and also the person coordinating the six scholarships. Now you might expect the lead organiser of a global conference for 150 delegates to be looking strained at every seam on the final morning of preparations but this couldn’t be further from the truth. A very fresh looking and cheerful Lynn greeted me warmly and within minutes had assigned me my first task. Over the entire conference, I watched as she zipped this way and that, cheerfully delegating, solving issues as they arose and working through her carefully planned checklists. This event had been planned to an amazing degree (well I guess it is an event for facilitators). The team of people who were beside Lynn in the event organisation were equally upbeat and focused with can do expressions, this leadership and teamwork style reverberated over the days and I heard numerous times if someone could do this or that and would here the same styled reply ‘If Lynn or one of the team is asking me to do something then, of course, no problem’. I have been involved in many, many events and I watch other skilled and thorough organisers perform their magic and this is one of their notable talents they share; to be able to enjoy the process, to plan well ahead and delegate clearly and to ooze a lightness of touch, together these are returned by an atmosphere of positivity.
As both a delegate and a scholar I was there to roll up my sleeves and to get stuck in where needed. My key task over the next few days was to assist the photographer, Steve Weinstock, by uploading the files of photos he captured onto two different platforms. Whilst my brain rebalanced in the first day after a long flight this was easier said than done but gradually I adjusted and got into the swing of the task and took memory stick after memory stick from Steve who relentlessly pursued the busy agenda capturing the golden people moments along with the numerous graphic records being created. For every session held, there were one or more people capturing a graphic record. At the end of the conference the main conference area, the hallways and the breakout rooms were all covered with amazing visuals of the content of the days in all sorts of styles.
When each session began there was a hilarious synchronised bowing of heads by the audience as each person was pulled to their own sketch pad to capture their own sketch notes. In so many other events/workshops there may be one or two people, or maybe even a handful that would be doing this, so to be surrounded by an entire conference gathering of other obsessive intentional doodlers and visual thinkers was an unusual but welcoming experience. It occurred to me even by early on in the preparation day, that I had already met a host of people and was chatting easily and feeling collegiate with an at home feeling I could have only hoped for. An opening welcome evening on Tuesday for all the delegation kicked off with a reception and short addresses from some of the key organisers.

The following morning the conference got into full swing. Now for those that don’t know the field of visual practice really took off in the 70’s and 80’s and one of the pioneers of that time, David Sibbet, has always been a great supporter of the IFVP. And whilst David Sibbet and many other leaders in the field were at the conference one of the truly special things about this community was the genuine non-hierarchical attitude and atmosphere of everyone. Whilst I had awestruck moments and acknowledgements of people’s legacy and expertise there was an equality and humanness that could not easily be explained by any one person’s action or behaviour. It was fascinating to hear David Sibbet describe the journey of visual practice emerging from 1970’s and whilst this is a journey I am familiar with there is nothing better than receiving water from the source. David described how there wasn’t a field in the 1970’s, then through noticing how architects worked together using diagrams to try to solve problems together a catalyst began. In 1979 David Sibbet began The Grove and wrote a first book ‘I see what you mean! An introduction to graphic language recording and facilitation. Meanwhile, a group of graphic recorders had started meeting and David came and joined them. David described this group as ‘this is a group who practice radical acceptance’, my reflection approximately 30 years later in Austin, Texas was that this is still the case.
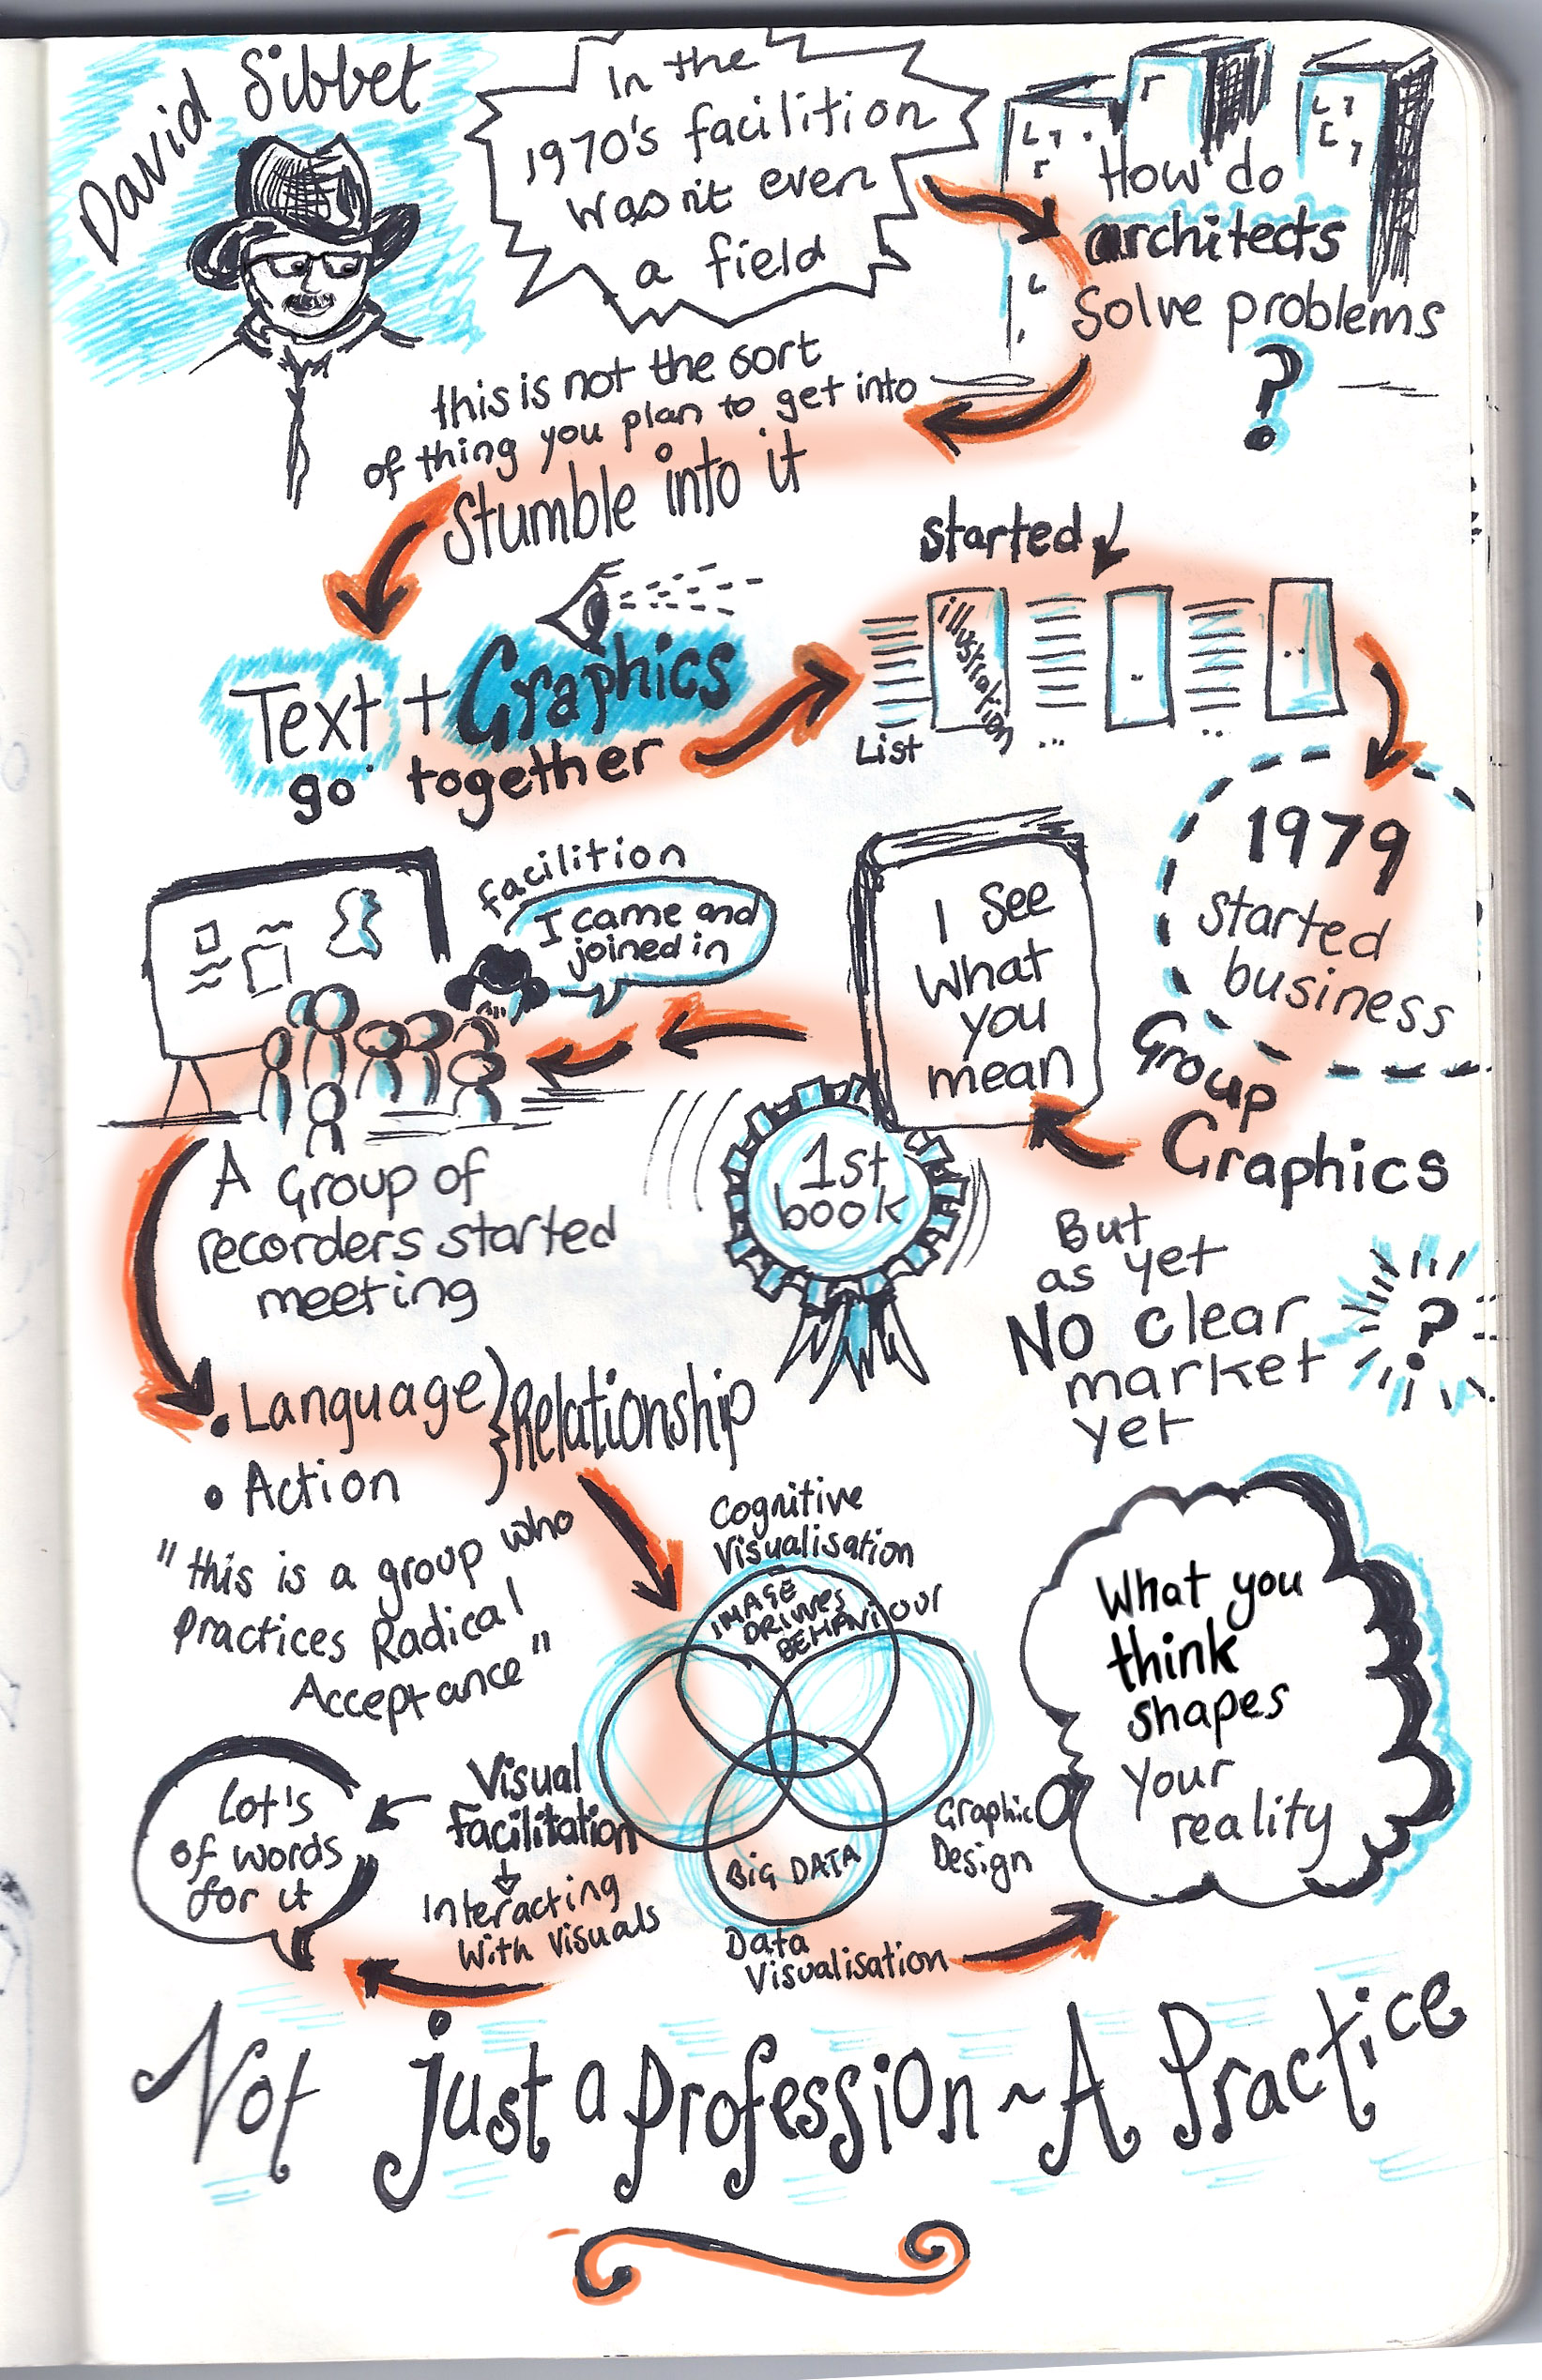
Over the next few days, I went on to speak to many people both those that had been in the field for a brief few days or weeks to those that extended back to the origins of the practice. And by speaking I don’t just mean a casual introduction, the conversations were rich and exploring constantly the how do we create our visuals to methods and approaches to the practice and process of facilitation. I spoke to people in the various workshops, I had conversations with different people at breakfast, lunch and dinner, there were discussions with people when gazing at graphic records and pondering over the book store and of course we also escaped the conference hotel on a few occasions (even if it was lovely) and ventured into Austin where the conversations even then orbited around the practice of facilitating processes. Another thing was apparent in these conversations and that was whilst it was clear people knew some people previously in different ways wherever you physically landed at any given time so spontaneously you became part of that conversation.
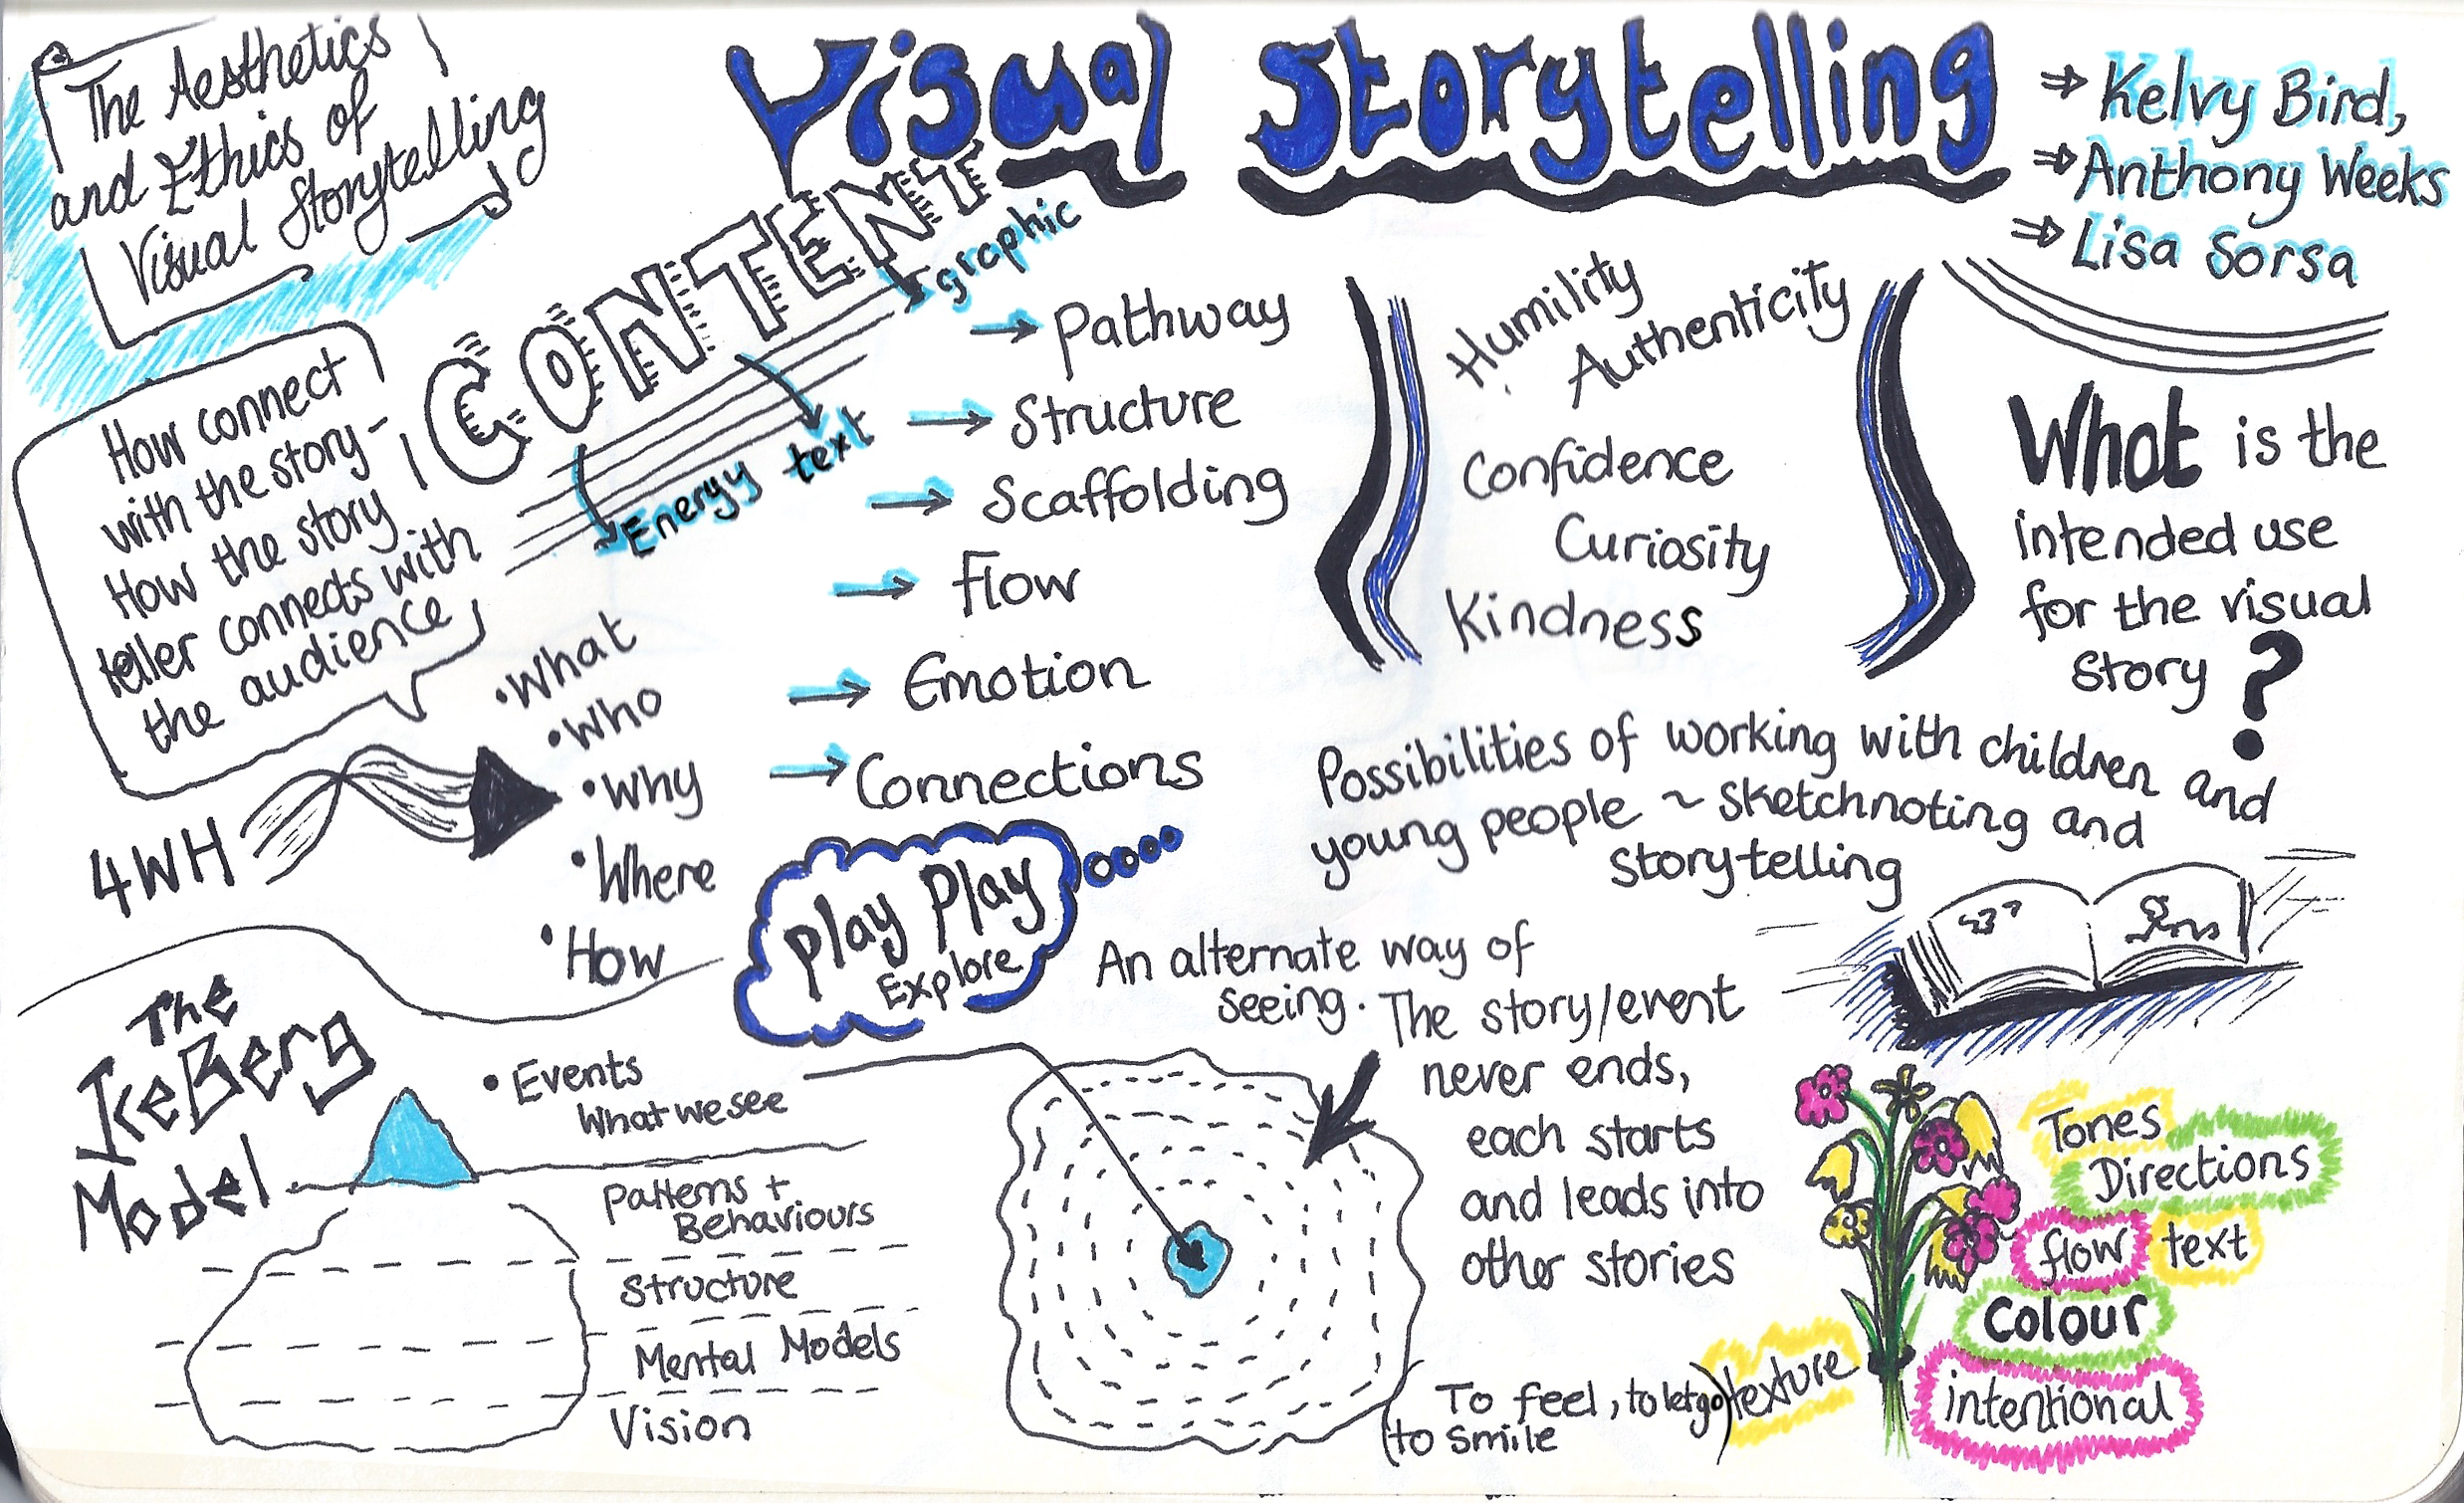
Of particular impression to many was a session on The Aesthetics and Ethics of Visual Storytelling by Kelvy Bird, Anthony Weeks and Lisa Sorsa. The three introduced their own approaches and took questions from the audience as they compared and contrasted thoughts about how what and why they did what they did. As graphic recorders of stories and narratives, they explored how we focus on active listening and listening in the broadest sense of the word, listening to the content, tone, body language, room dynamics and meanings and our role is to distil and capture the flow and create a reflection of all that we hear. They explored how when we are graphic recording we are not empty vessels but that we aim to purposefully be aware of our own content, that we knowingly and actively apply filters and it is our role to check these filters to ensure they are the right fit for the nature of the activity in hand. A key learning here was to grasp that graphic recordings capture a story but that each story has no absolute end or beginning and as one ends so begins another. The metaphor of an iceberg was used to help visualise this message and how if you look at an iceberg from the side, seeing the tip above the water and the mass below the water, you have one perspective. If you flip your view to look at the iceberg from above, another perspective reveals itself, of rings expanding outward (similar to rings of a trees ages) and that each progression moves into the next. Kelvy Bird explores this dynamic further and how it applies to facilitation on her website http://www.kelvybird.com/storytelling
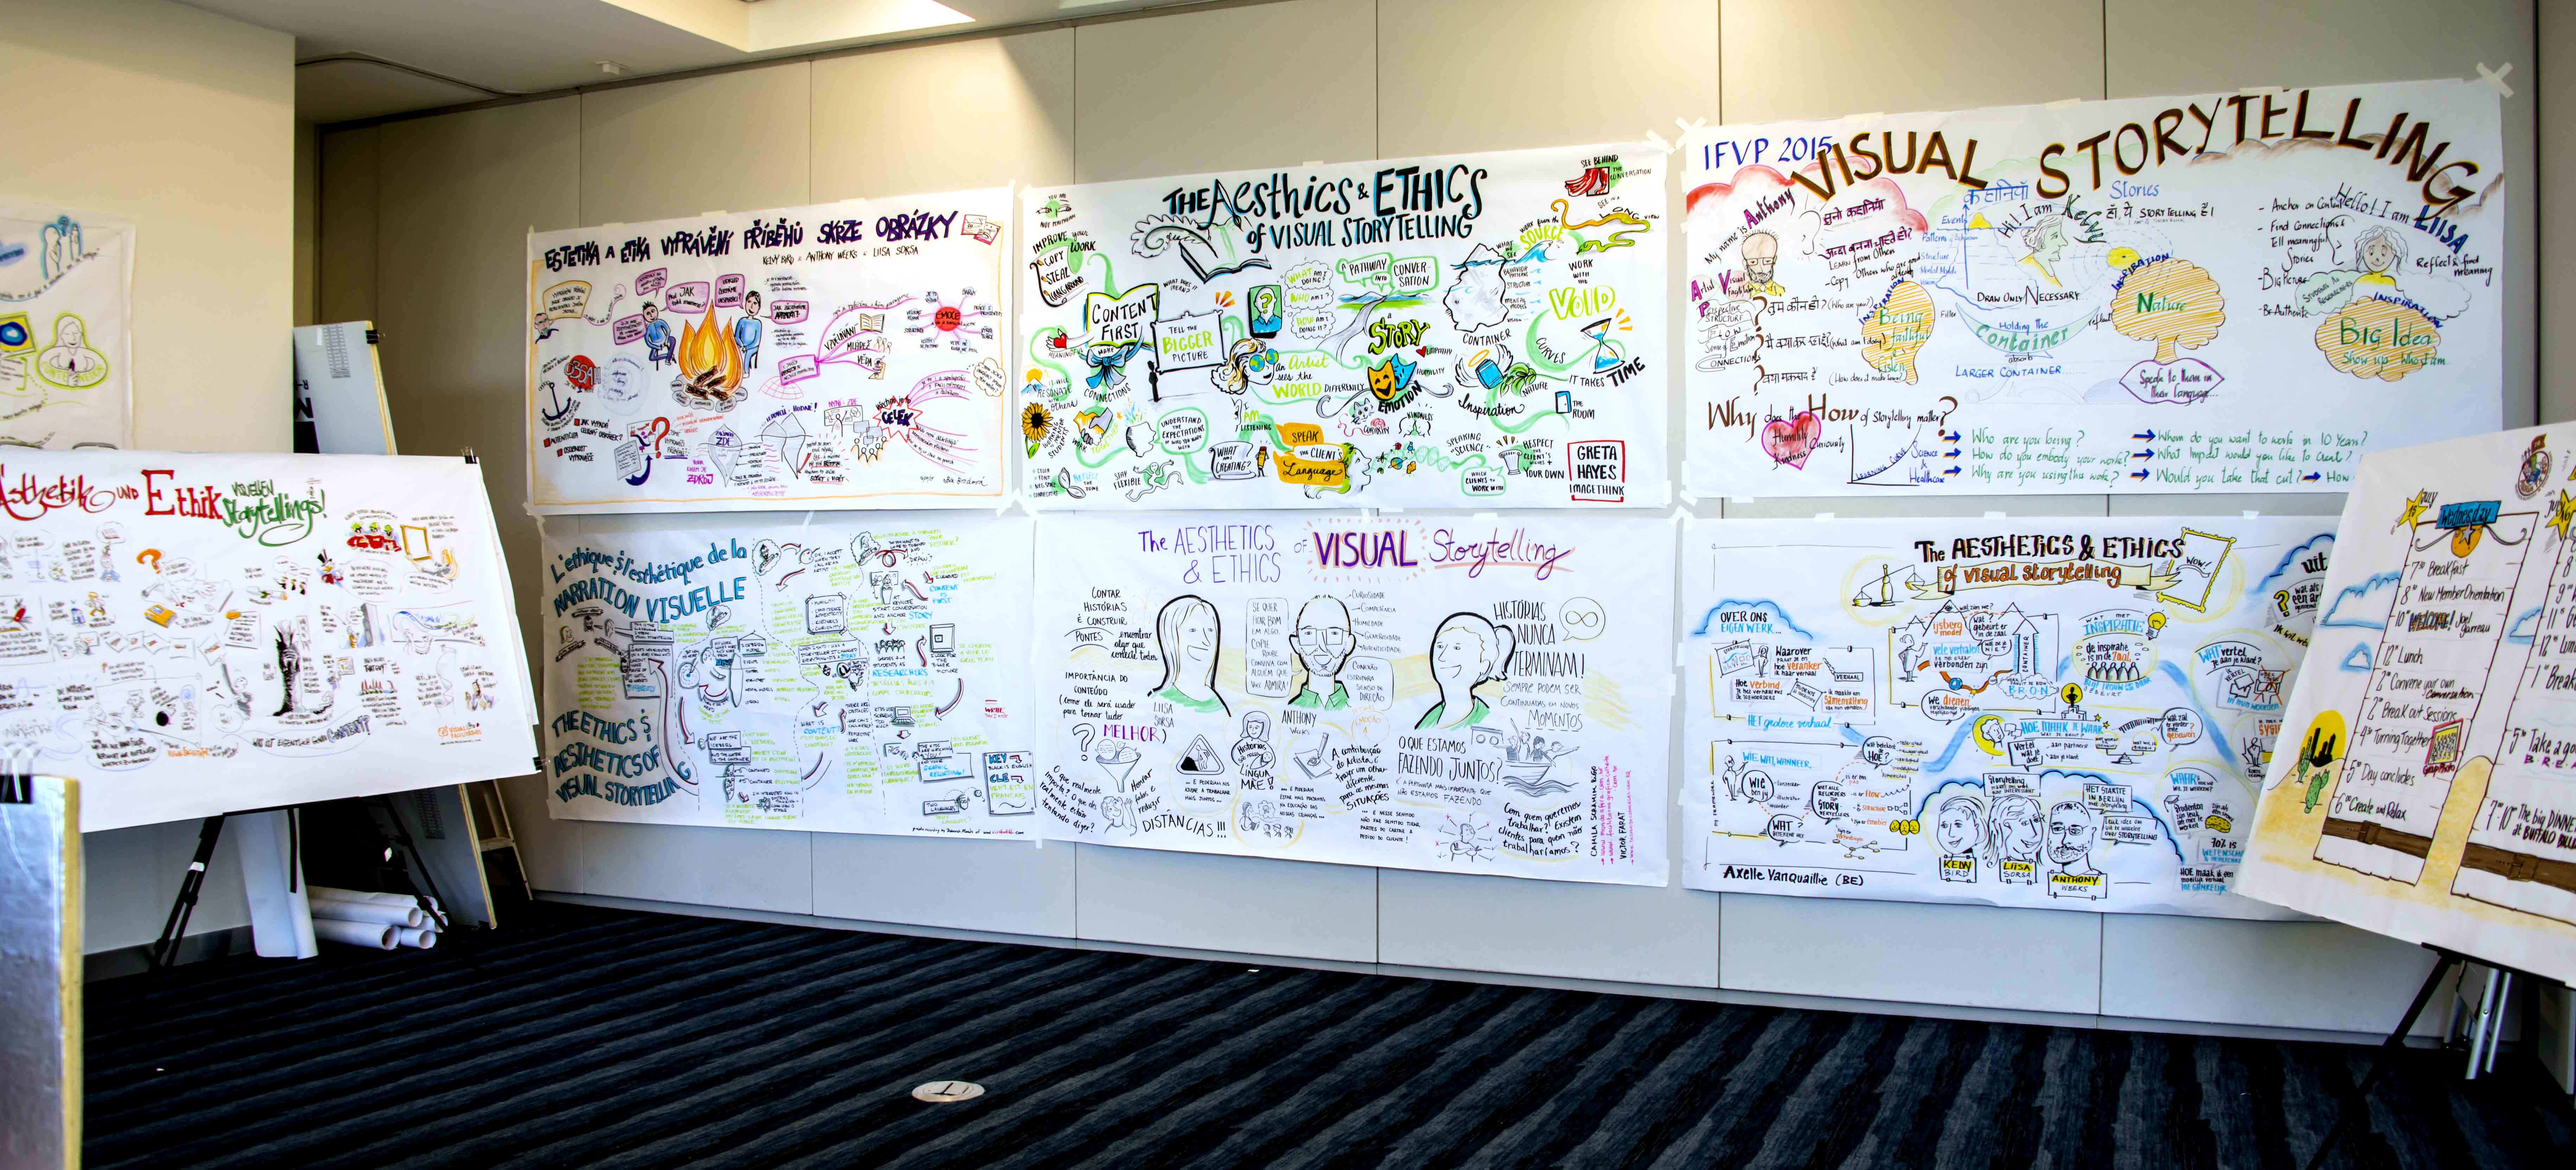
The IFVP aims to stretch frontiers of the work of visual practice and a very notable moment was while the Visual Story telling session was happening an amazing nine different recorders were simultaneously recording the same session but each in a different language. This tremendous achievement was fascinating to witness. The reflections from the recorders at the end of the session indicated a common theme from those recording, that to listen in one language and to flip into translation in another and then back to listening repeatedly was far more difficult than anticipated. People described almost feeling the mechanisms and effort in their brains as they jumped between the language listen and the translate and record modes. Fair play to them all they did a marvellous job and another great potential opens up for the community. Below is a photo of the graphic records all gathered together following the session (these can be seen individually on Flickr).
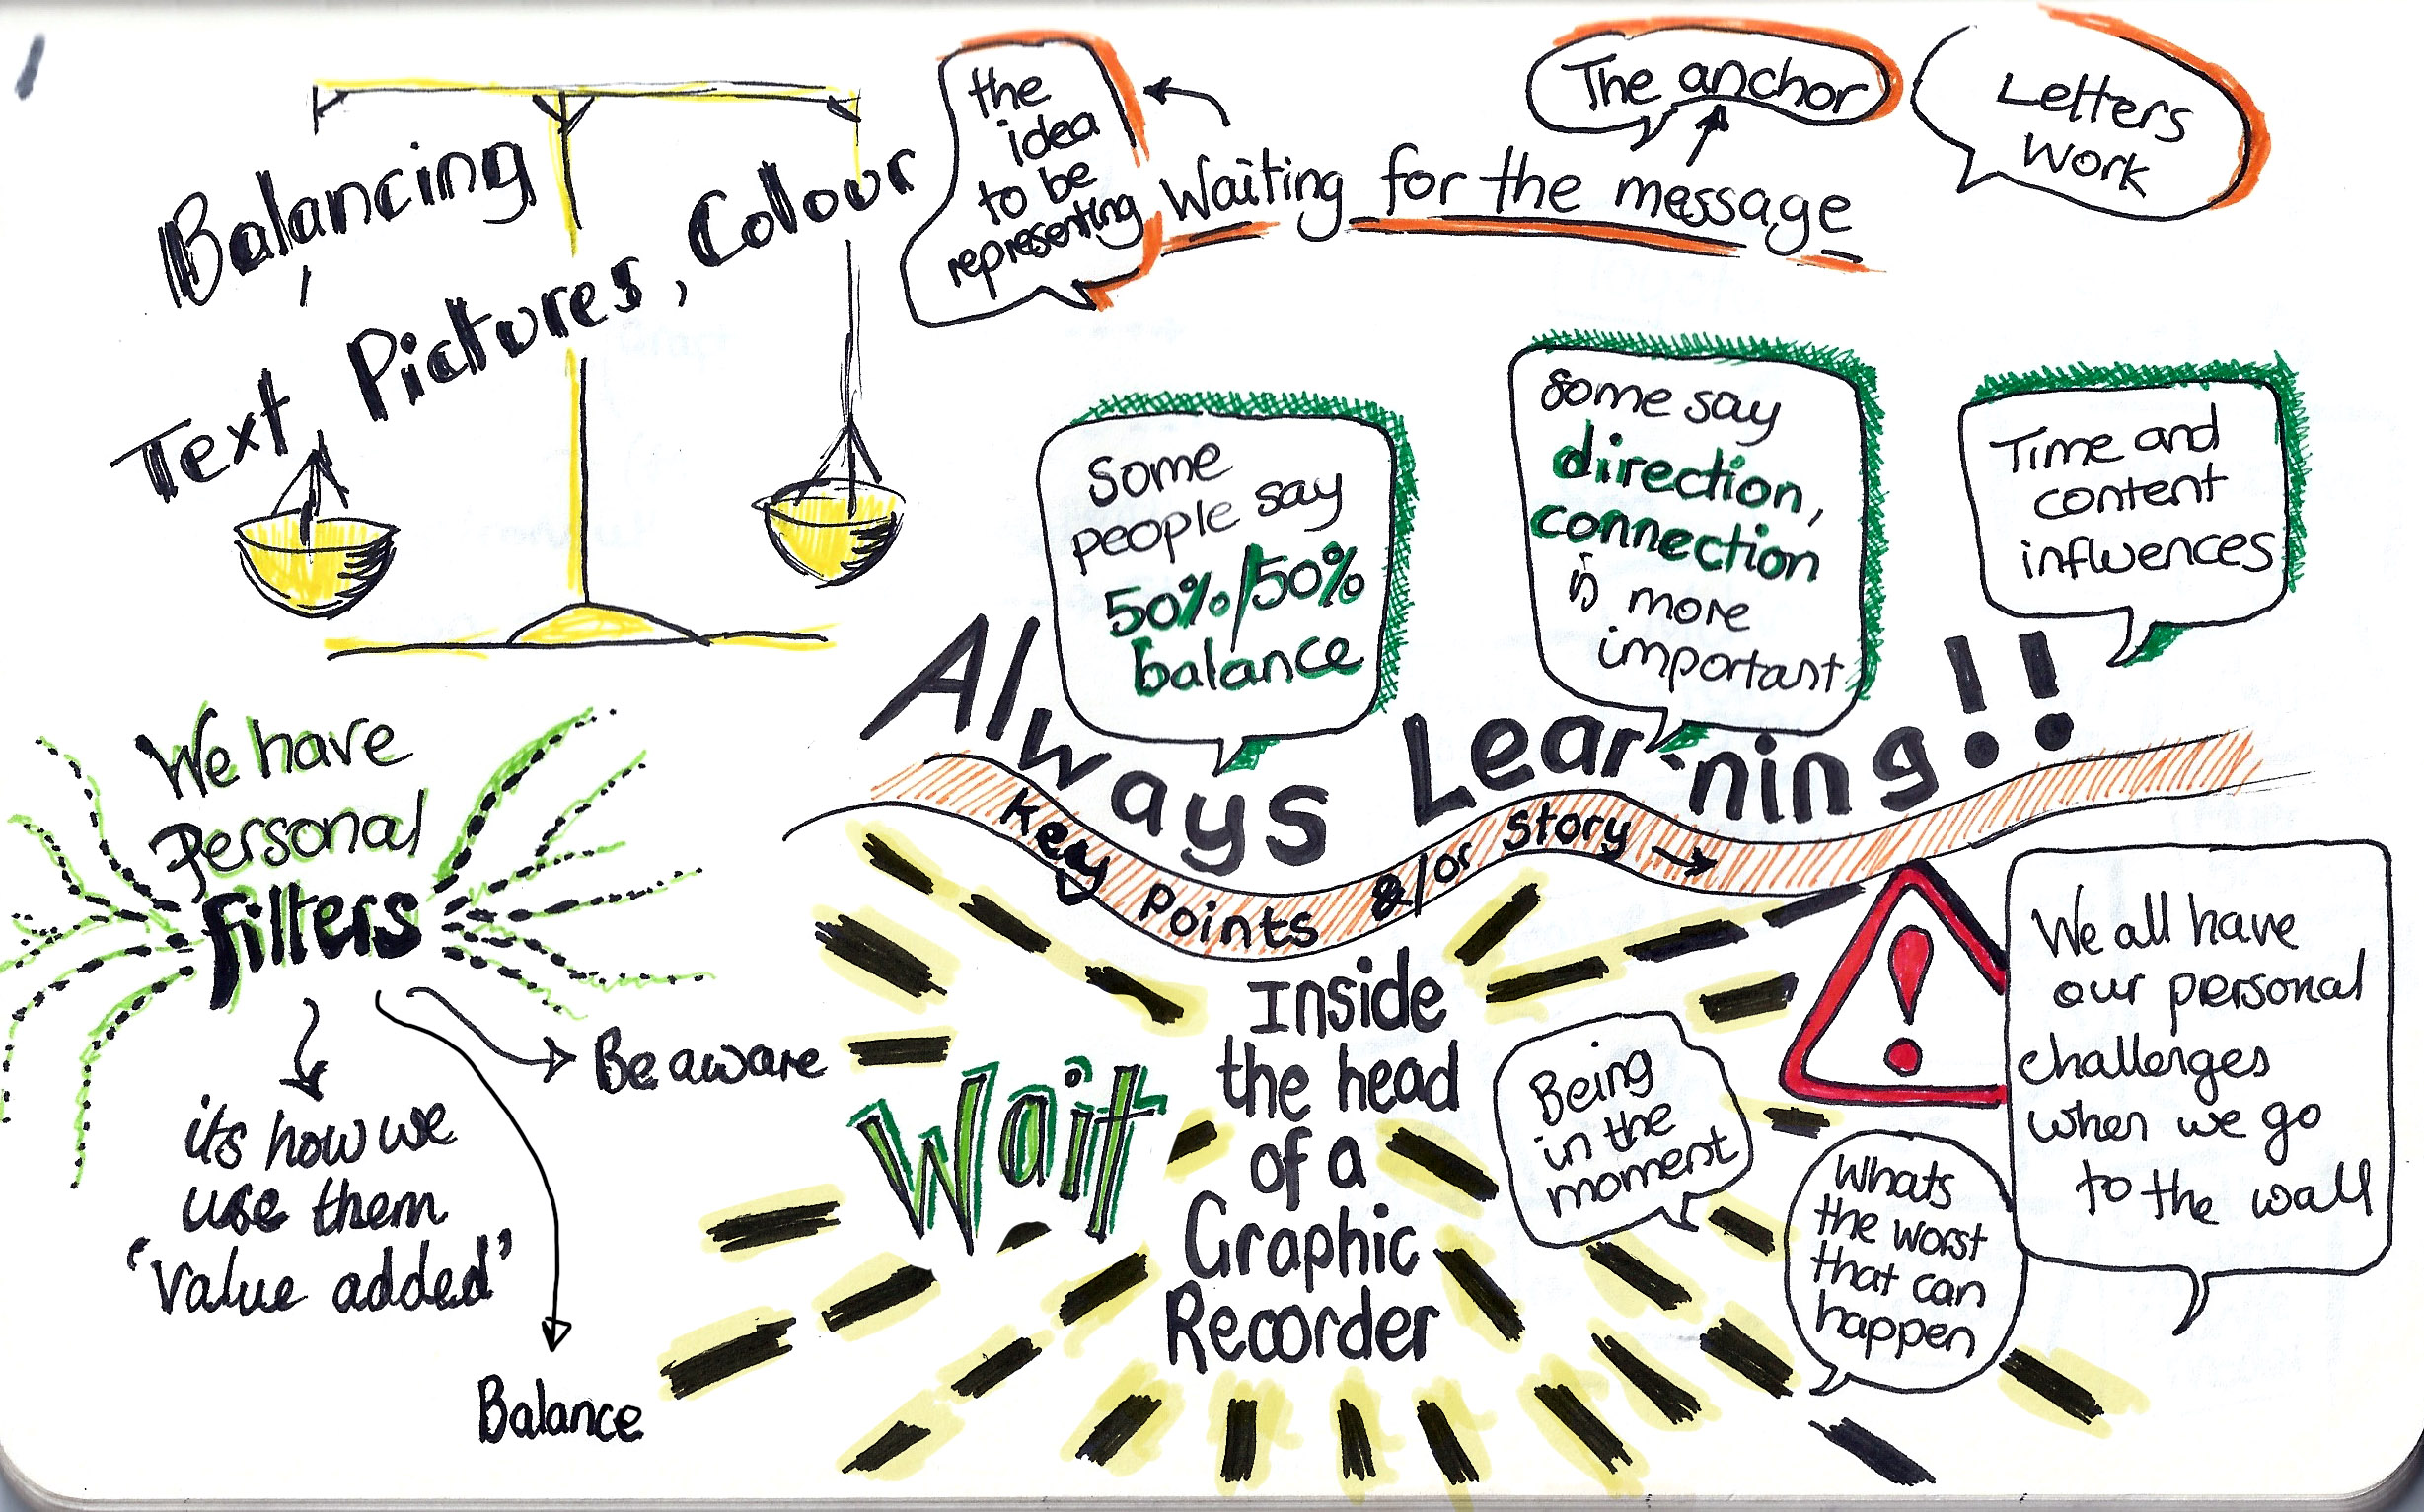
One session explored the process for a graphic recorder of live graphic recording, the session ‘inside the graphic recorders head’ (also available online to watch. http://www.ifvp.org/content/getting-into-the-head-of-graphic-recorder ) The idea was to use the same short TED talk and watch as each person graphic recorded the same talk one after another to further explore the process and different methods and styles of graphic recording. This was a particularly generous give by the recorders as the reality is in an 8minute TED talk there is only going to be so much time to capture and certainly limited time to polish and finish (the bits that we often do in the pauses and the breaks). This was an incredibly revealing and useful session illuminating the individuality of the process whilst also sharing the listening for key anchors and content within any talk or content.
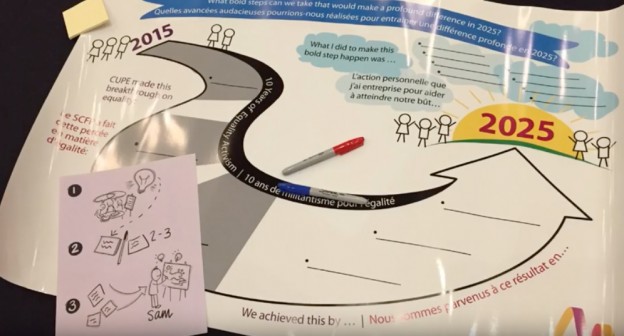
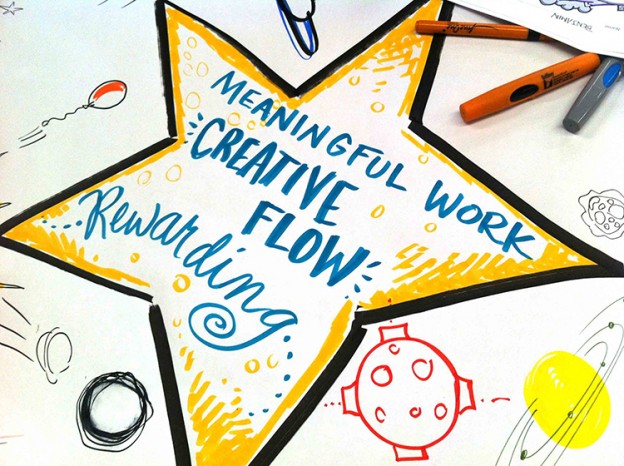
There were so many other memorable sessions and stellar presenters that would fill much more pages but I guess I need to stop somewhere.Toward the end of the conference OGSystems http://www.ogsystems.com illuminated the interconnections between us all session using the metaphor of orbiting and planets, this was a creative and enjoyable session with great visual templates for people to participate in across the room and with great potential for using in many areas.
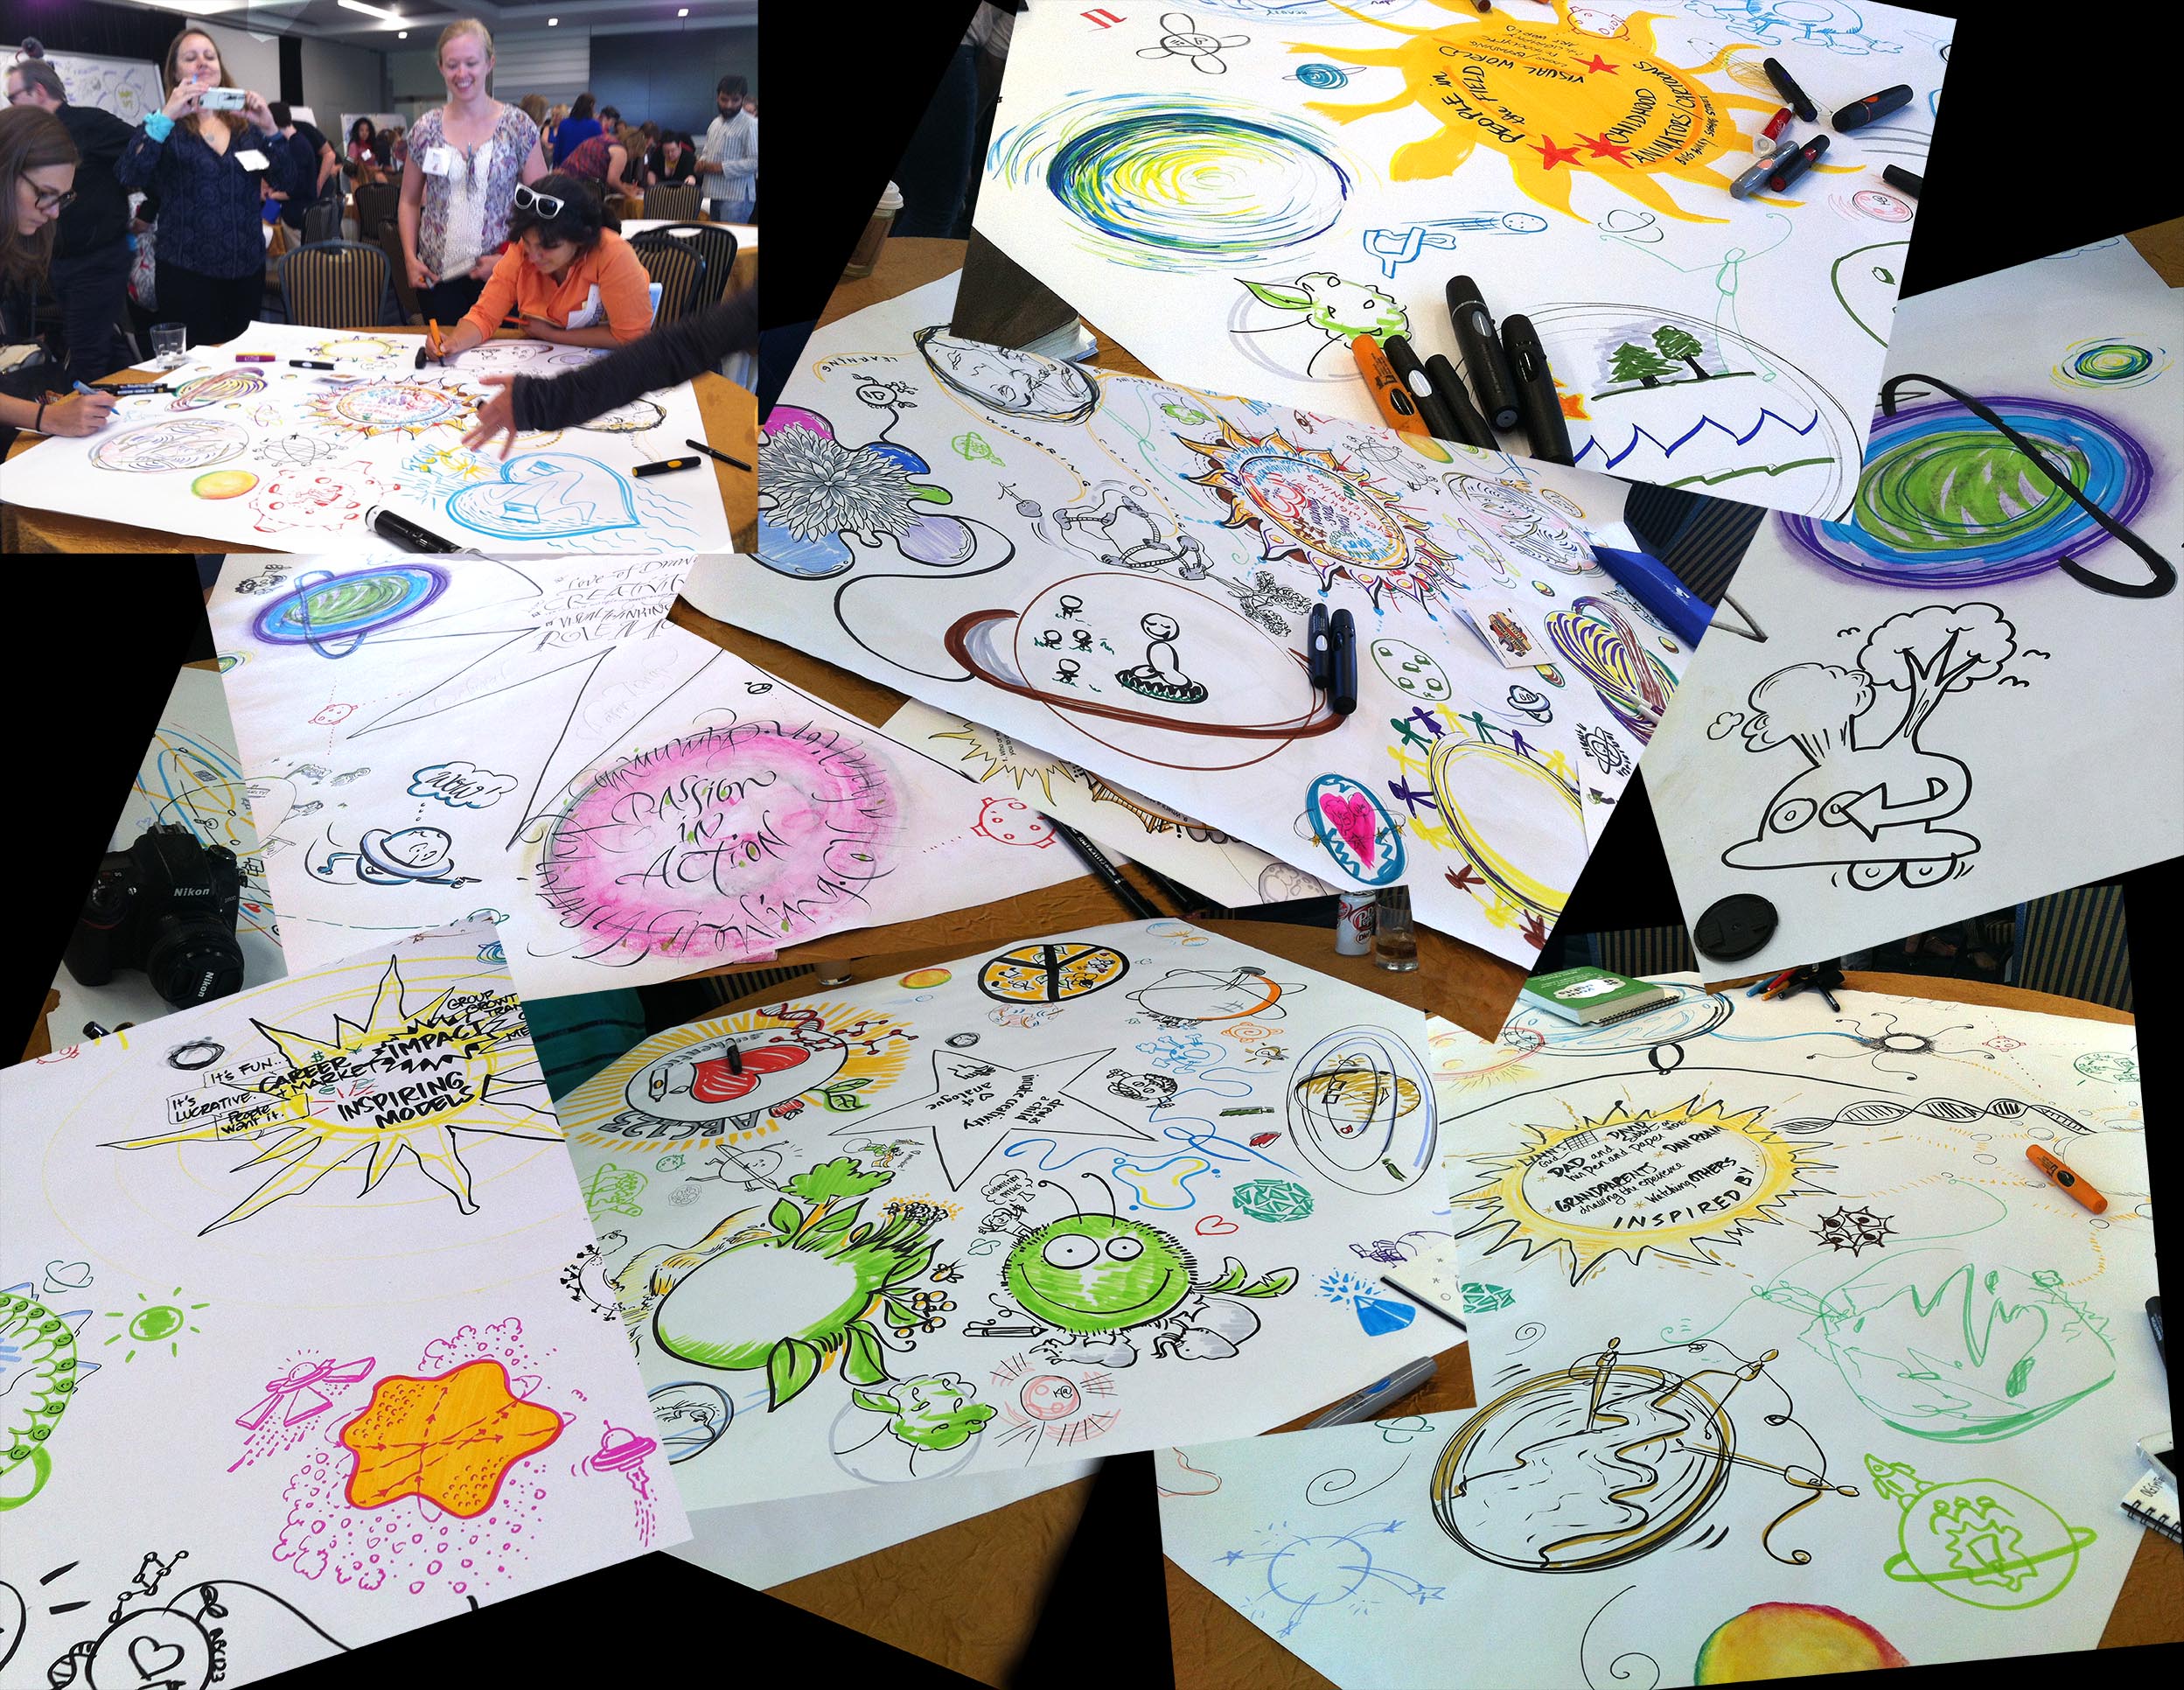
From meaningful, reflective, creative and interactive sessions there was also time for many lighter moments. On one occasion we were indulged with by the uplifting and observational humour of Julie Gieseke who parodied the experience of a graphic recorder in a merciless way sending the audience reeling with knowing laughter and wincing in recognition.
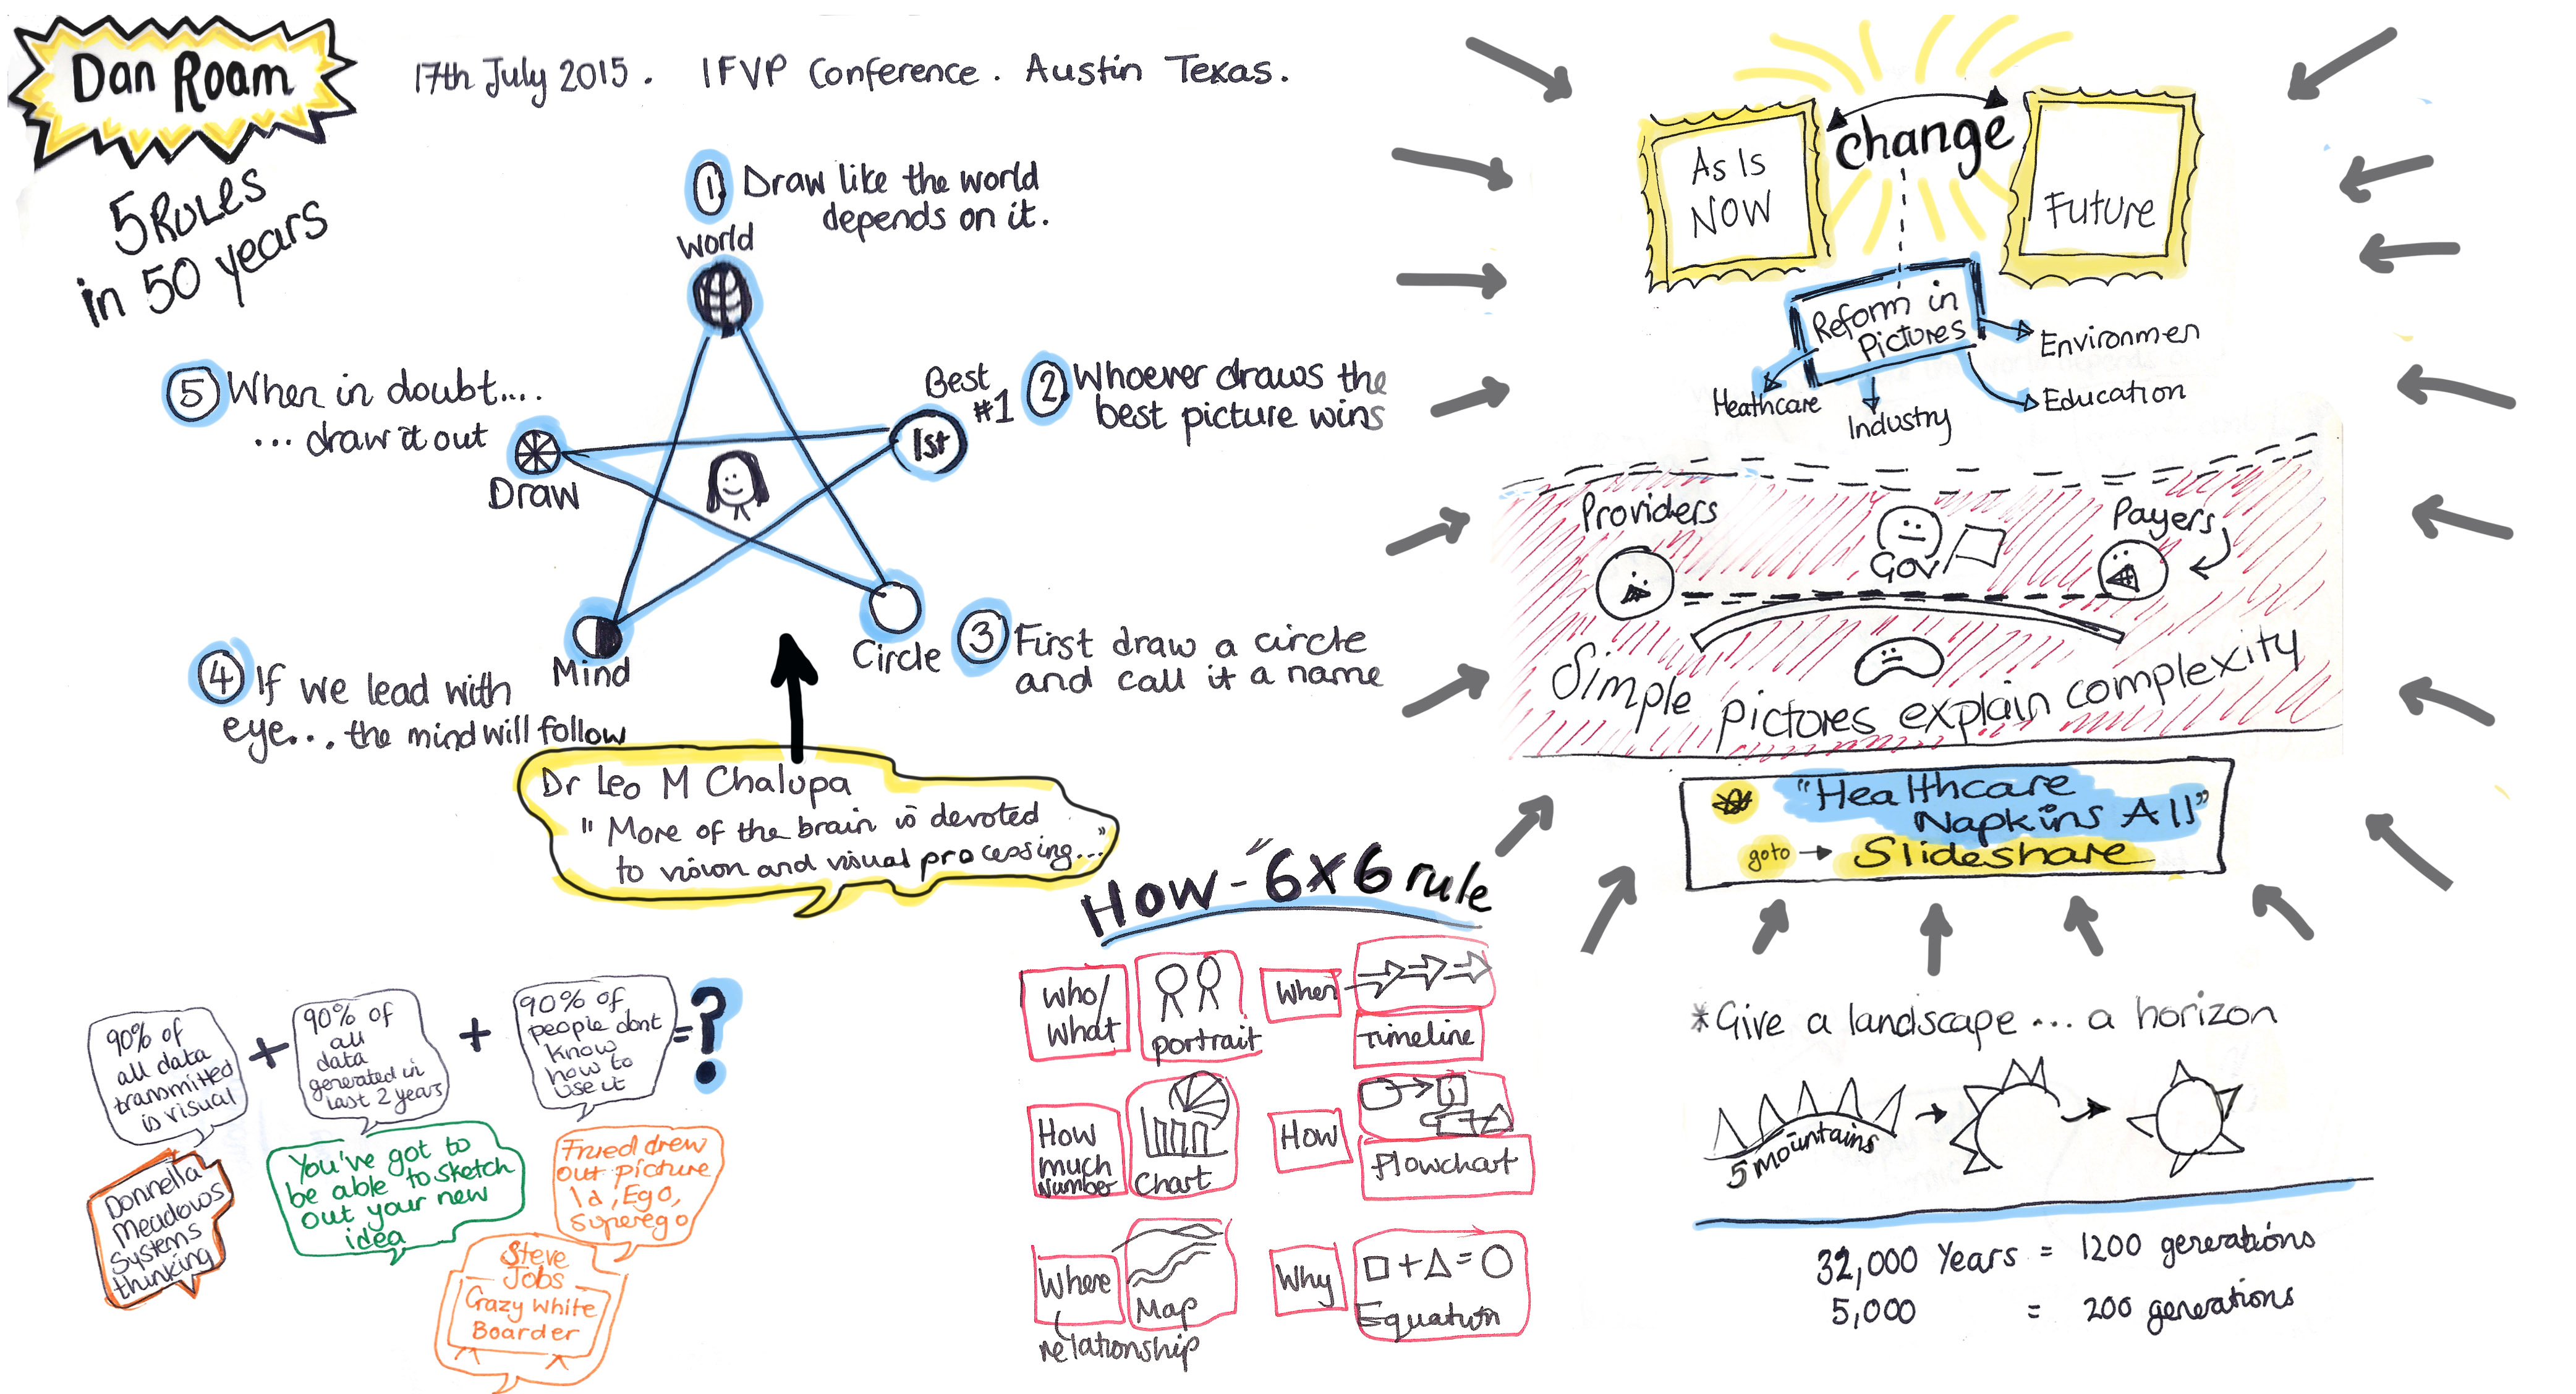
On the final afternoon Dan Roam, the author of the international bestseller, “The Back of the Napkin: Solving Problems and Selling Ideas with Pictures,” spent some time describing the strengths within really basic and simplistic drawings to convey complex ideas with the great potential to help people ‘see’ what you’re talking about.
A few final things to mention; the IFVP is an entirely volunteer led organisation, all of the Board members and those involved in the organising volunteer their time. This is particularly astounding given the sheer amount of time it takes to organise any conference, let alone a global conference, add to this the on going communication and activity throughout the year I really do take my hat off to them all and thank them all sincerely for their hard work and bringing together this unique opportunity and learning experience. The IFVP now has a new President following the Annual General Meeting and welcomes Jenny Trautman to the role.
To end, I have come away with so many new inspirations and the ideas are percolating fiercely. I met and made connections with people from far and wide and I know there were still many I did not get the chance to connect with but there is always our online networking that bridge the time and distance between these rare opportunities. Those people attending from Europe had a discussion on one of the mornings about developing the networking within Europe so look out for developments about this. From all of this I hope to bring back to my own practice and that of Engage Visually a whole new blast of energy, methods and techniques to support people and organisations in their thinking, planning and actions. I leave you with a list of links below if you would like to explore more of the content from the conference and if you have any questions you would like to explore from my reflections please do ask. I look forward to the conversations and possibilities of where visual thinking, visual practice and graphic facilitation will go from here.
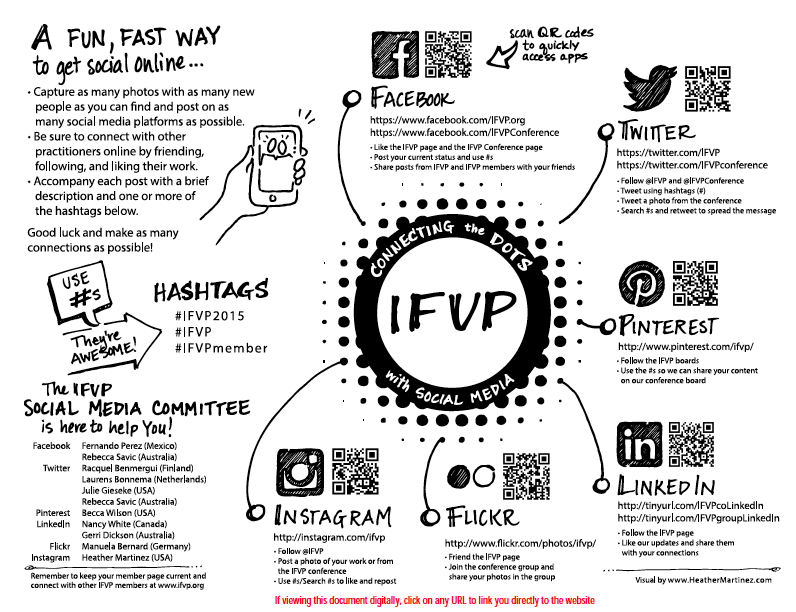
There is much more content, photos and videos from the conference please do explore through any of the following;
#IFVP2015 OR www.ifvp.org
or follow any of these signposts

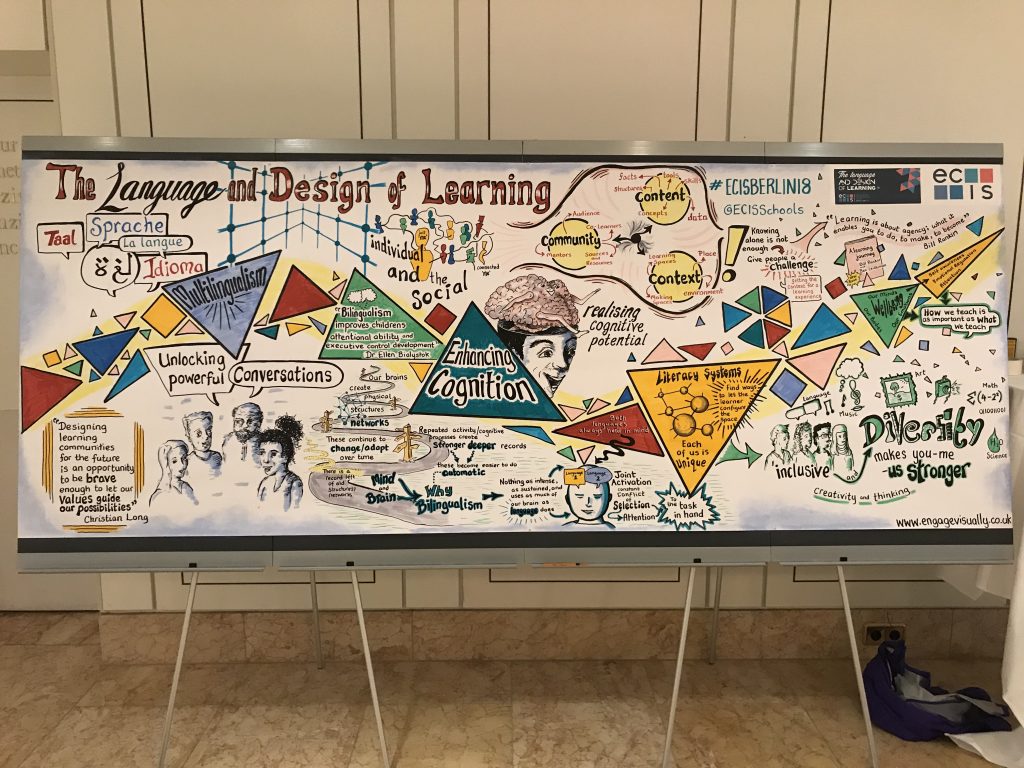
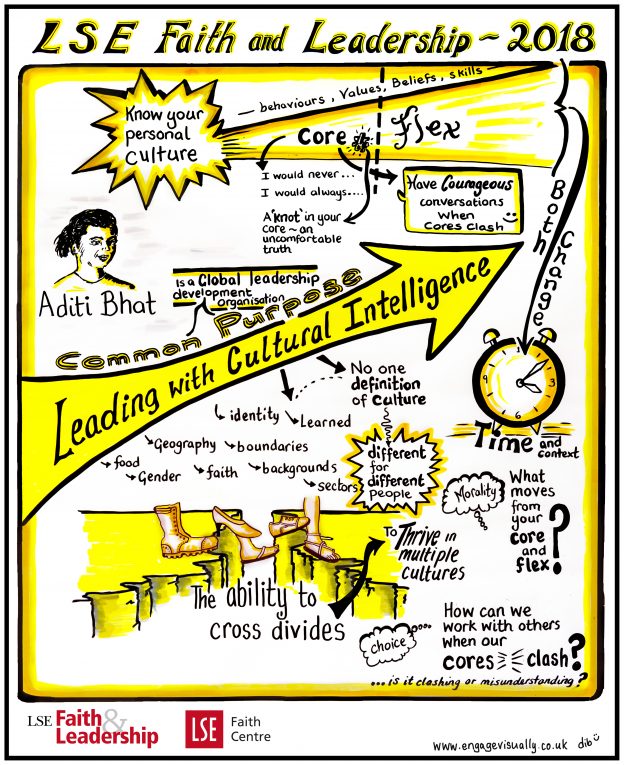
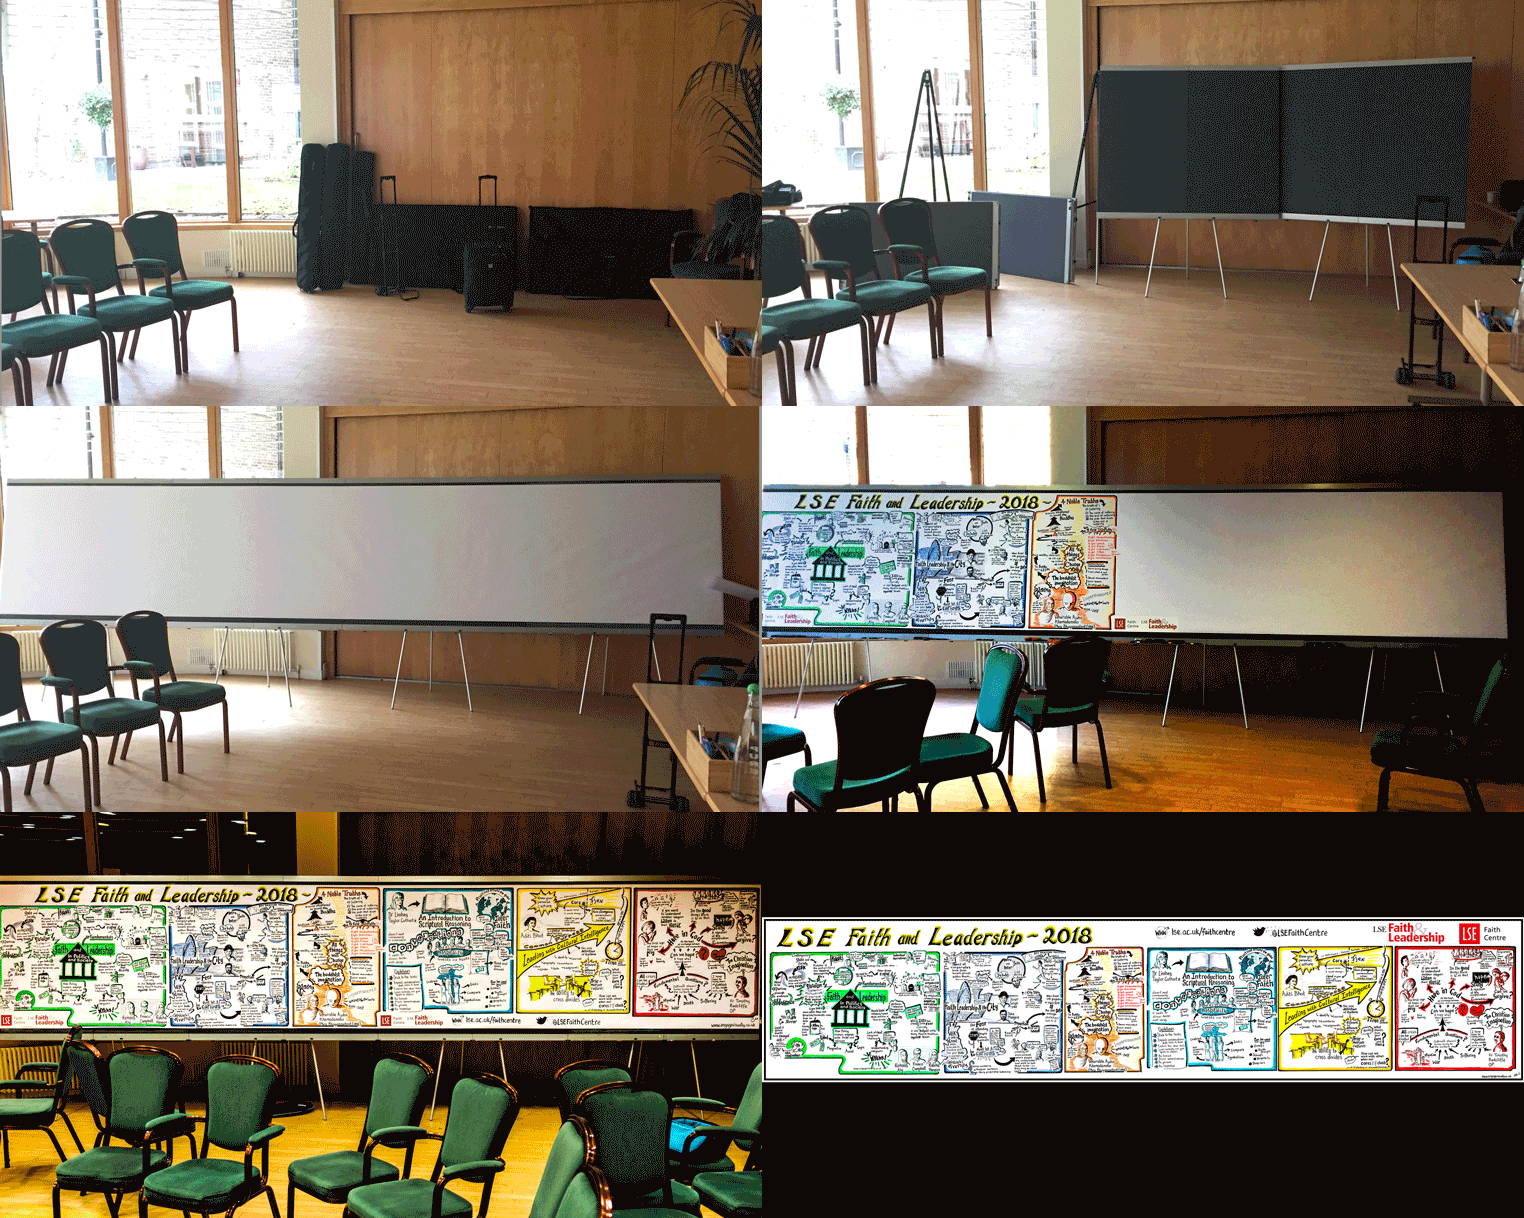
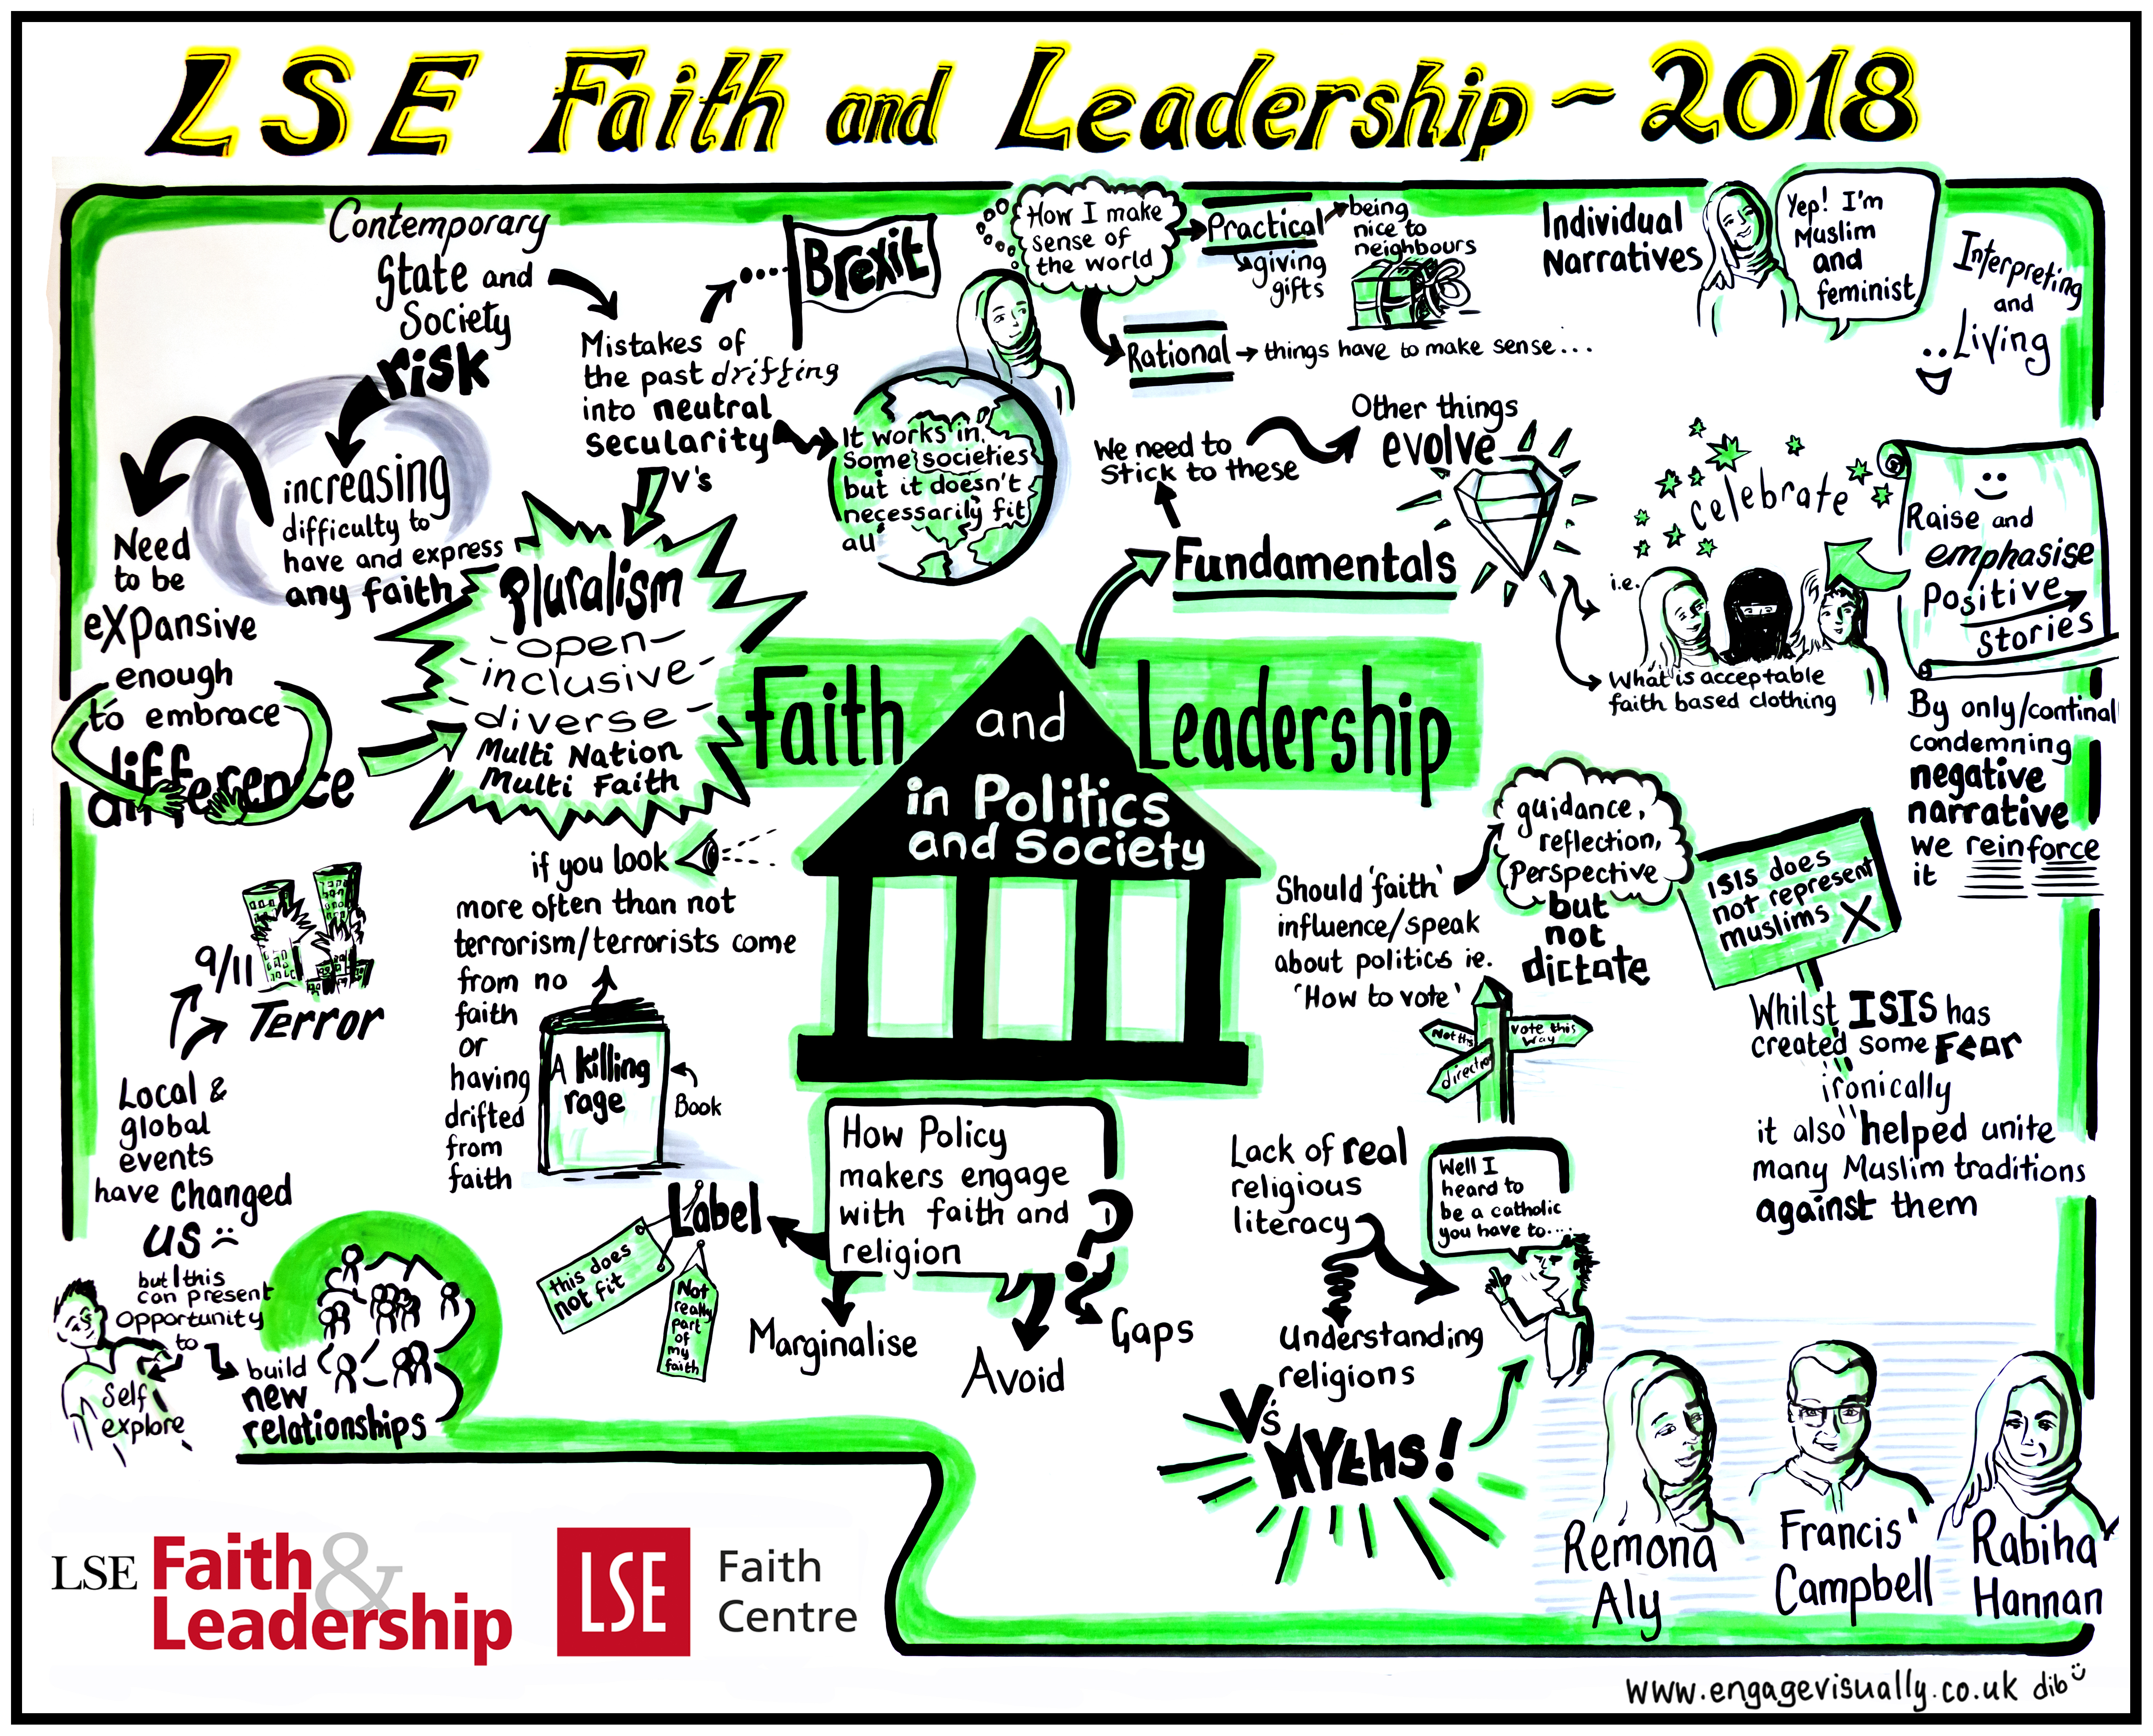
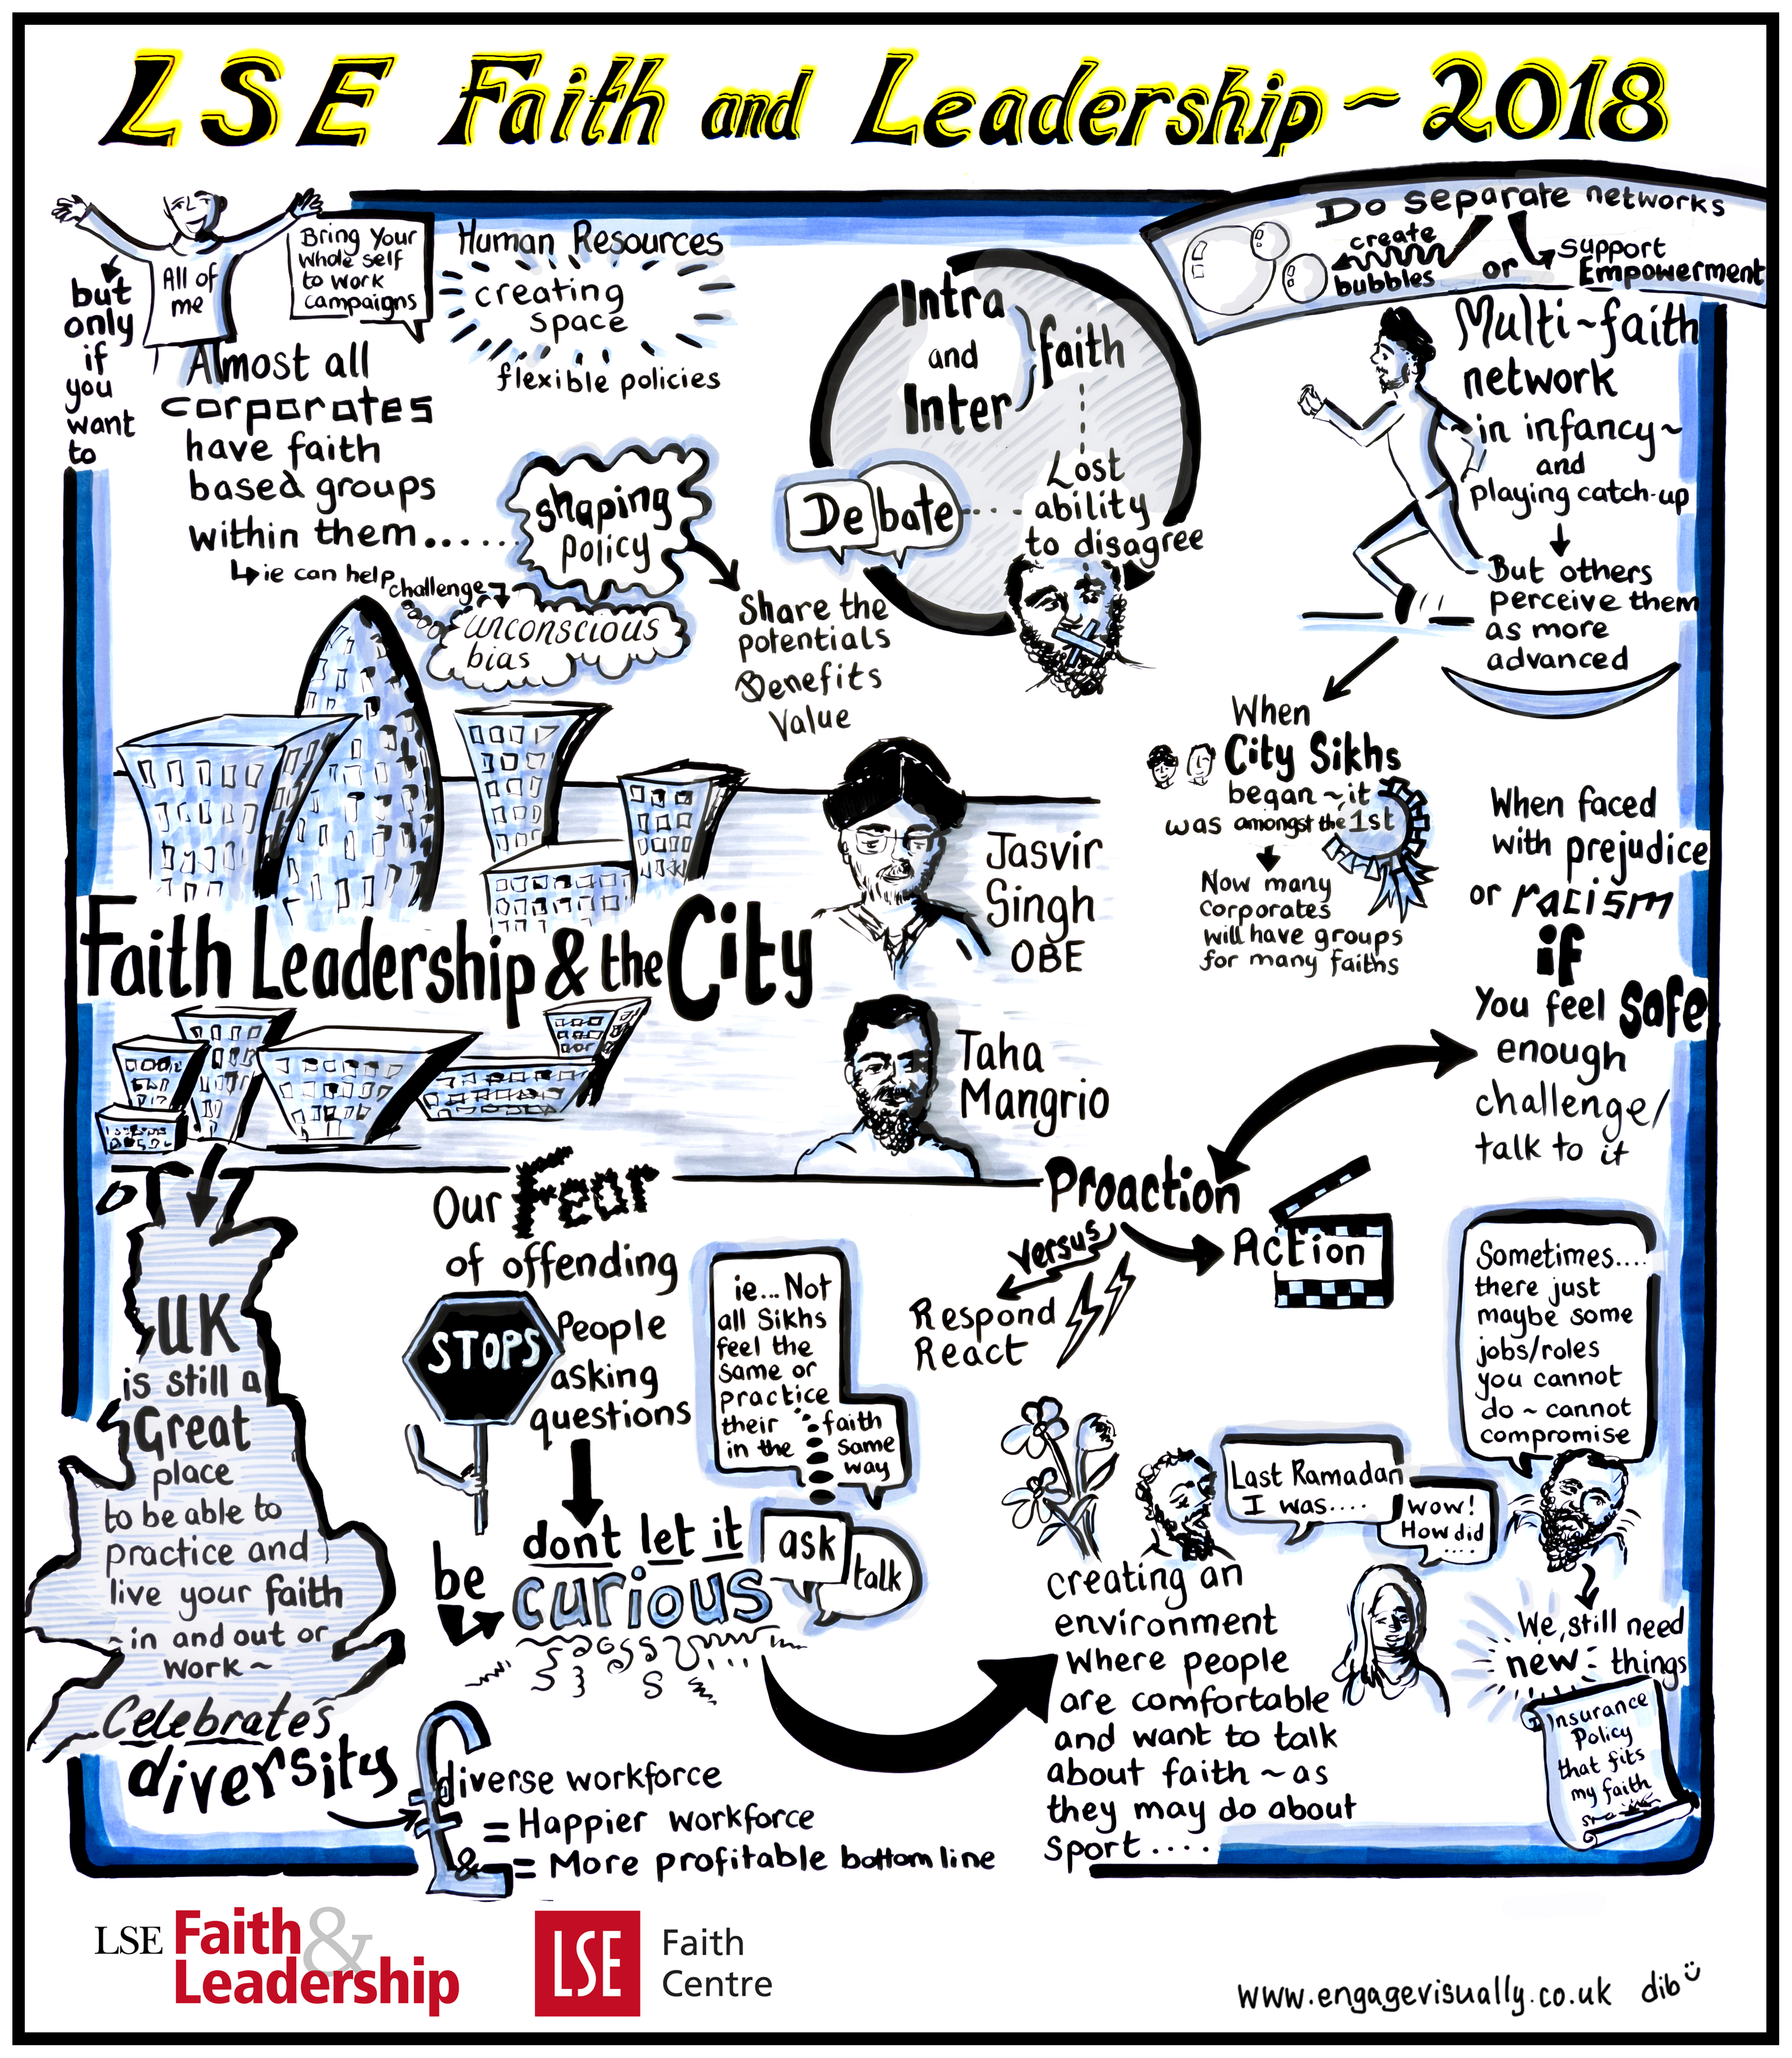
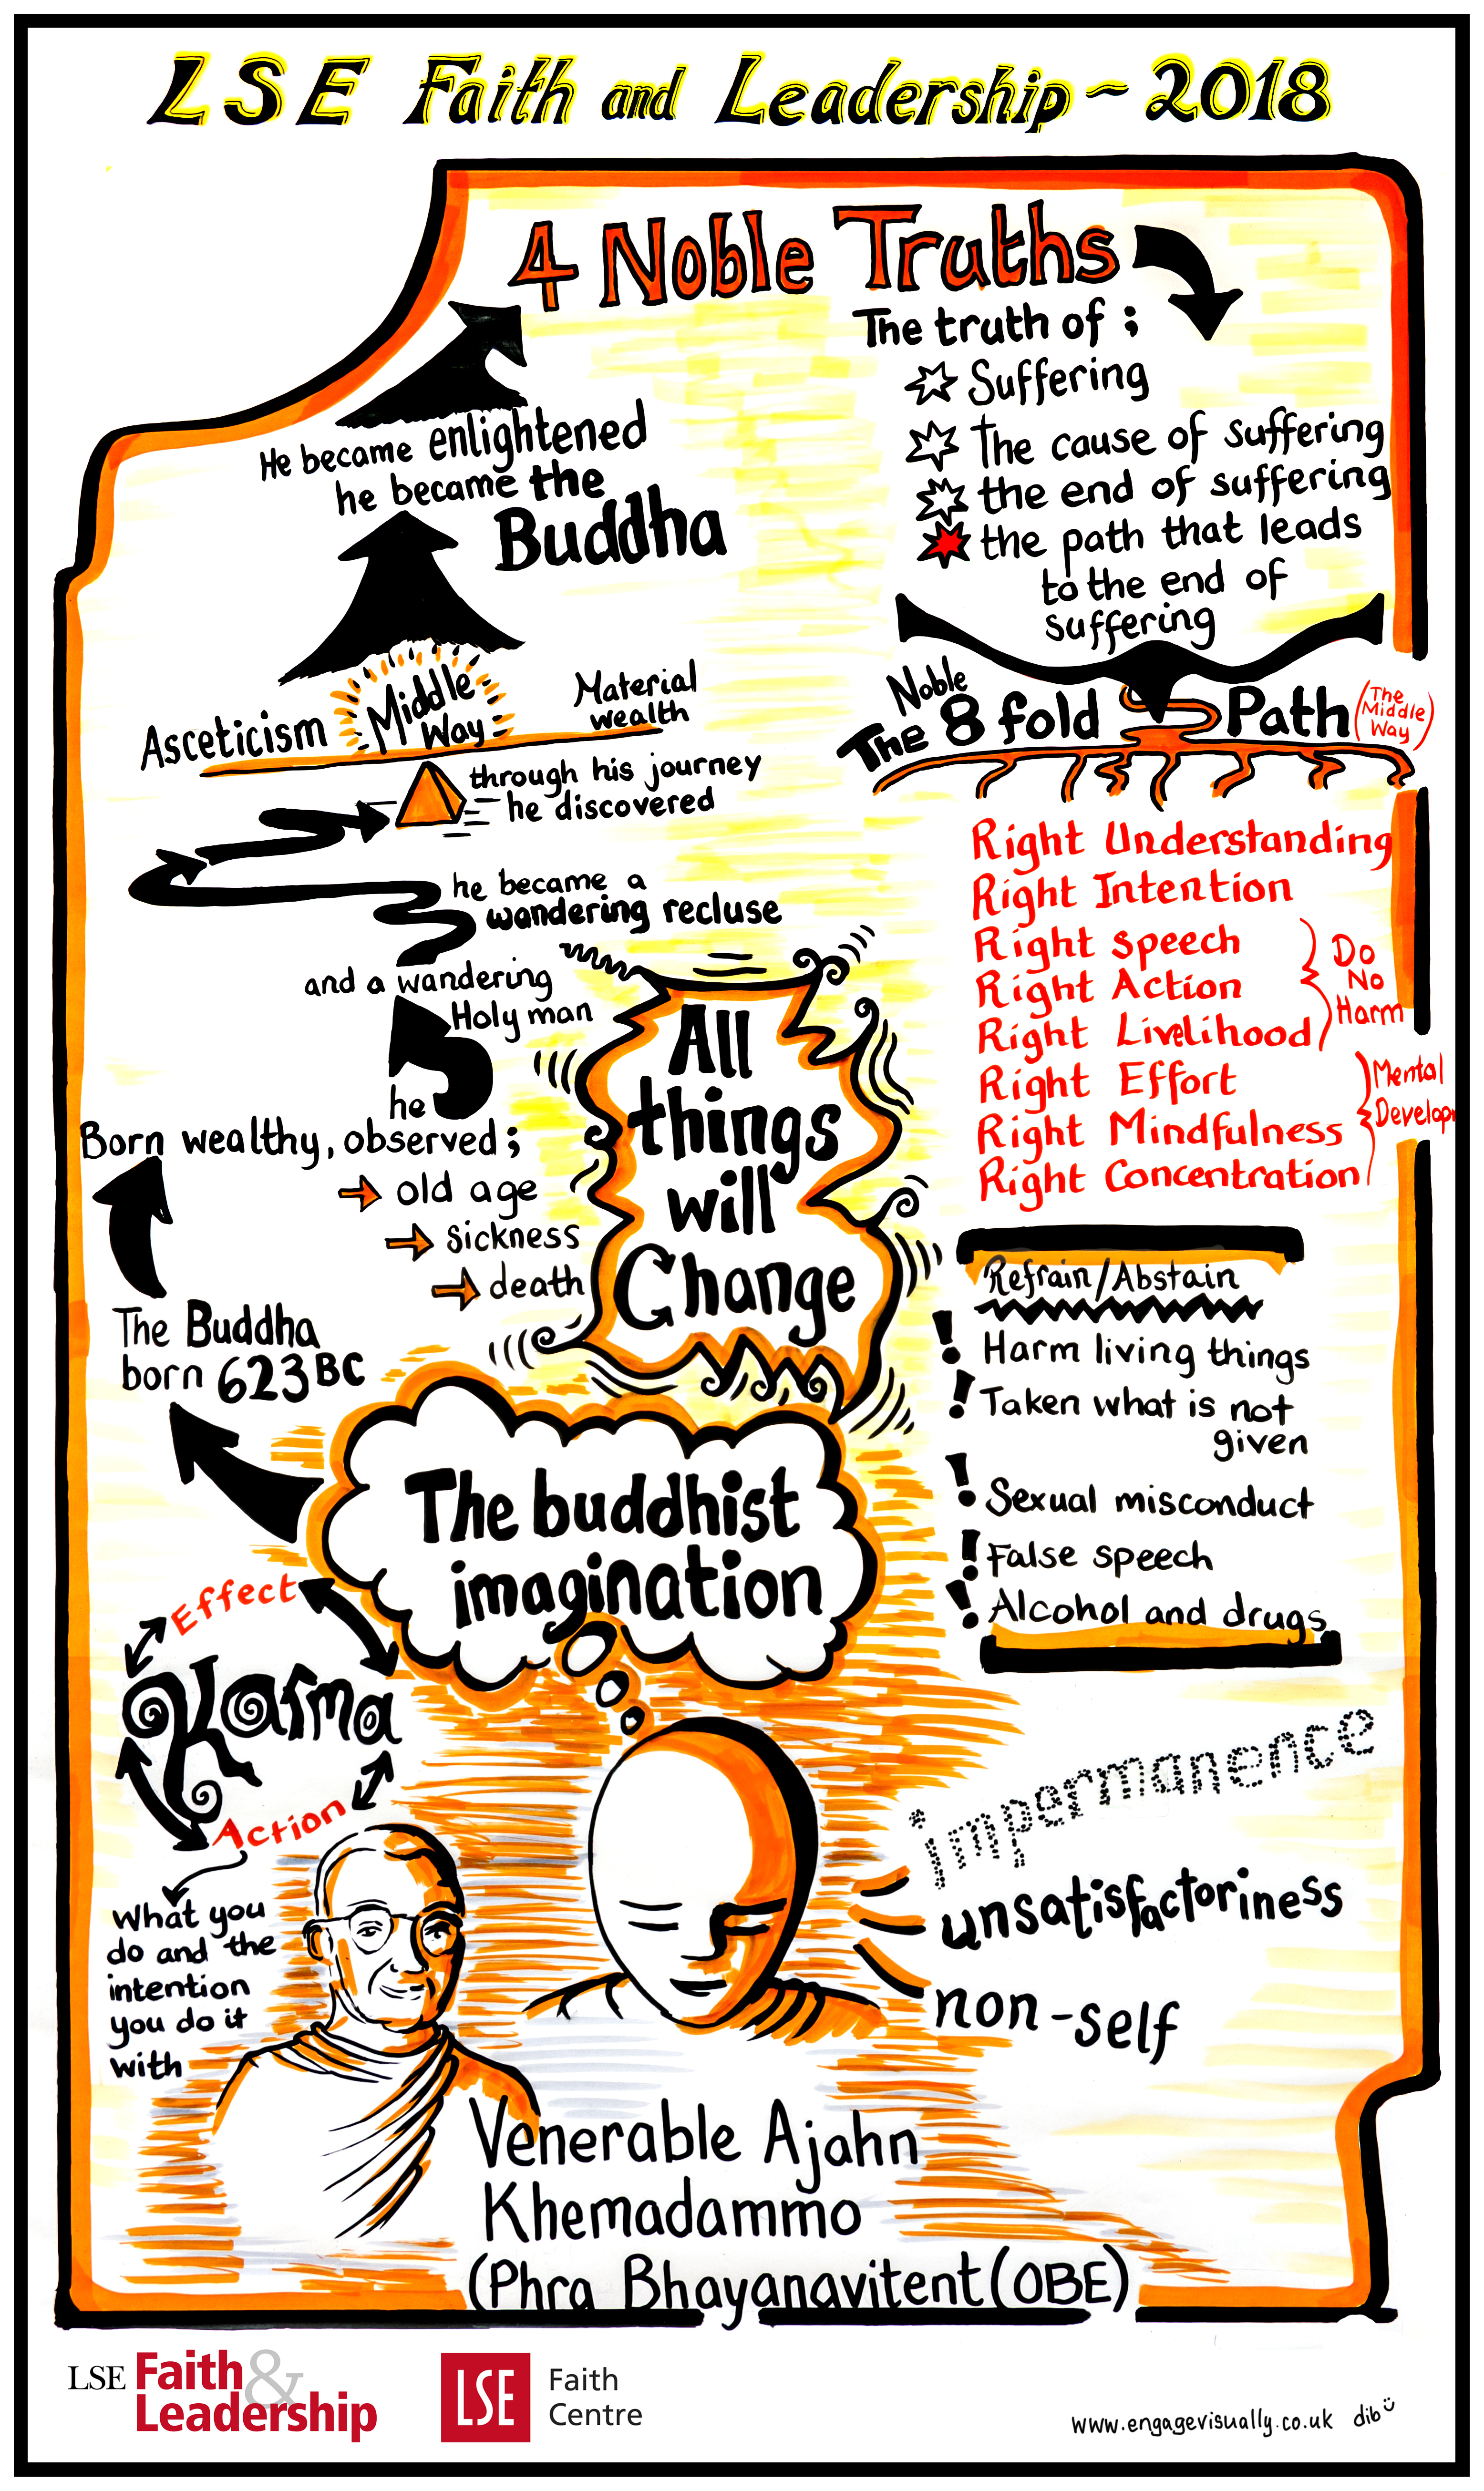
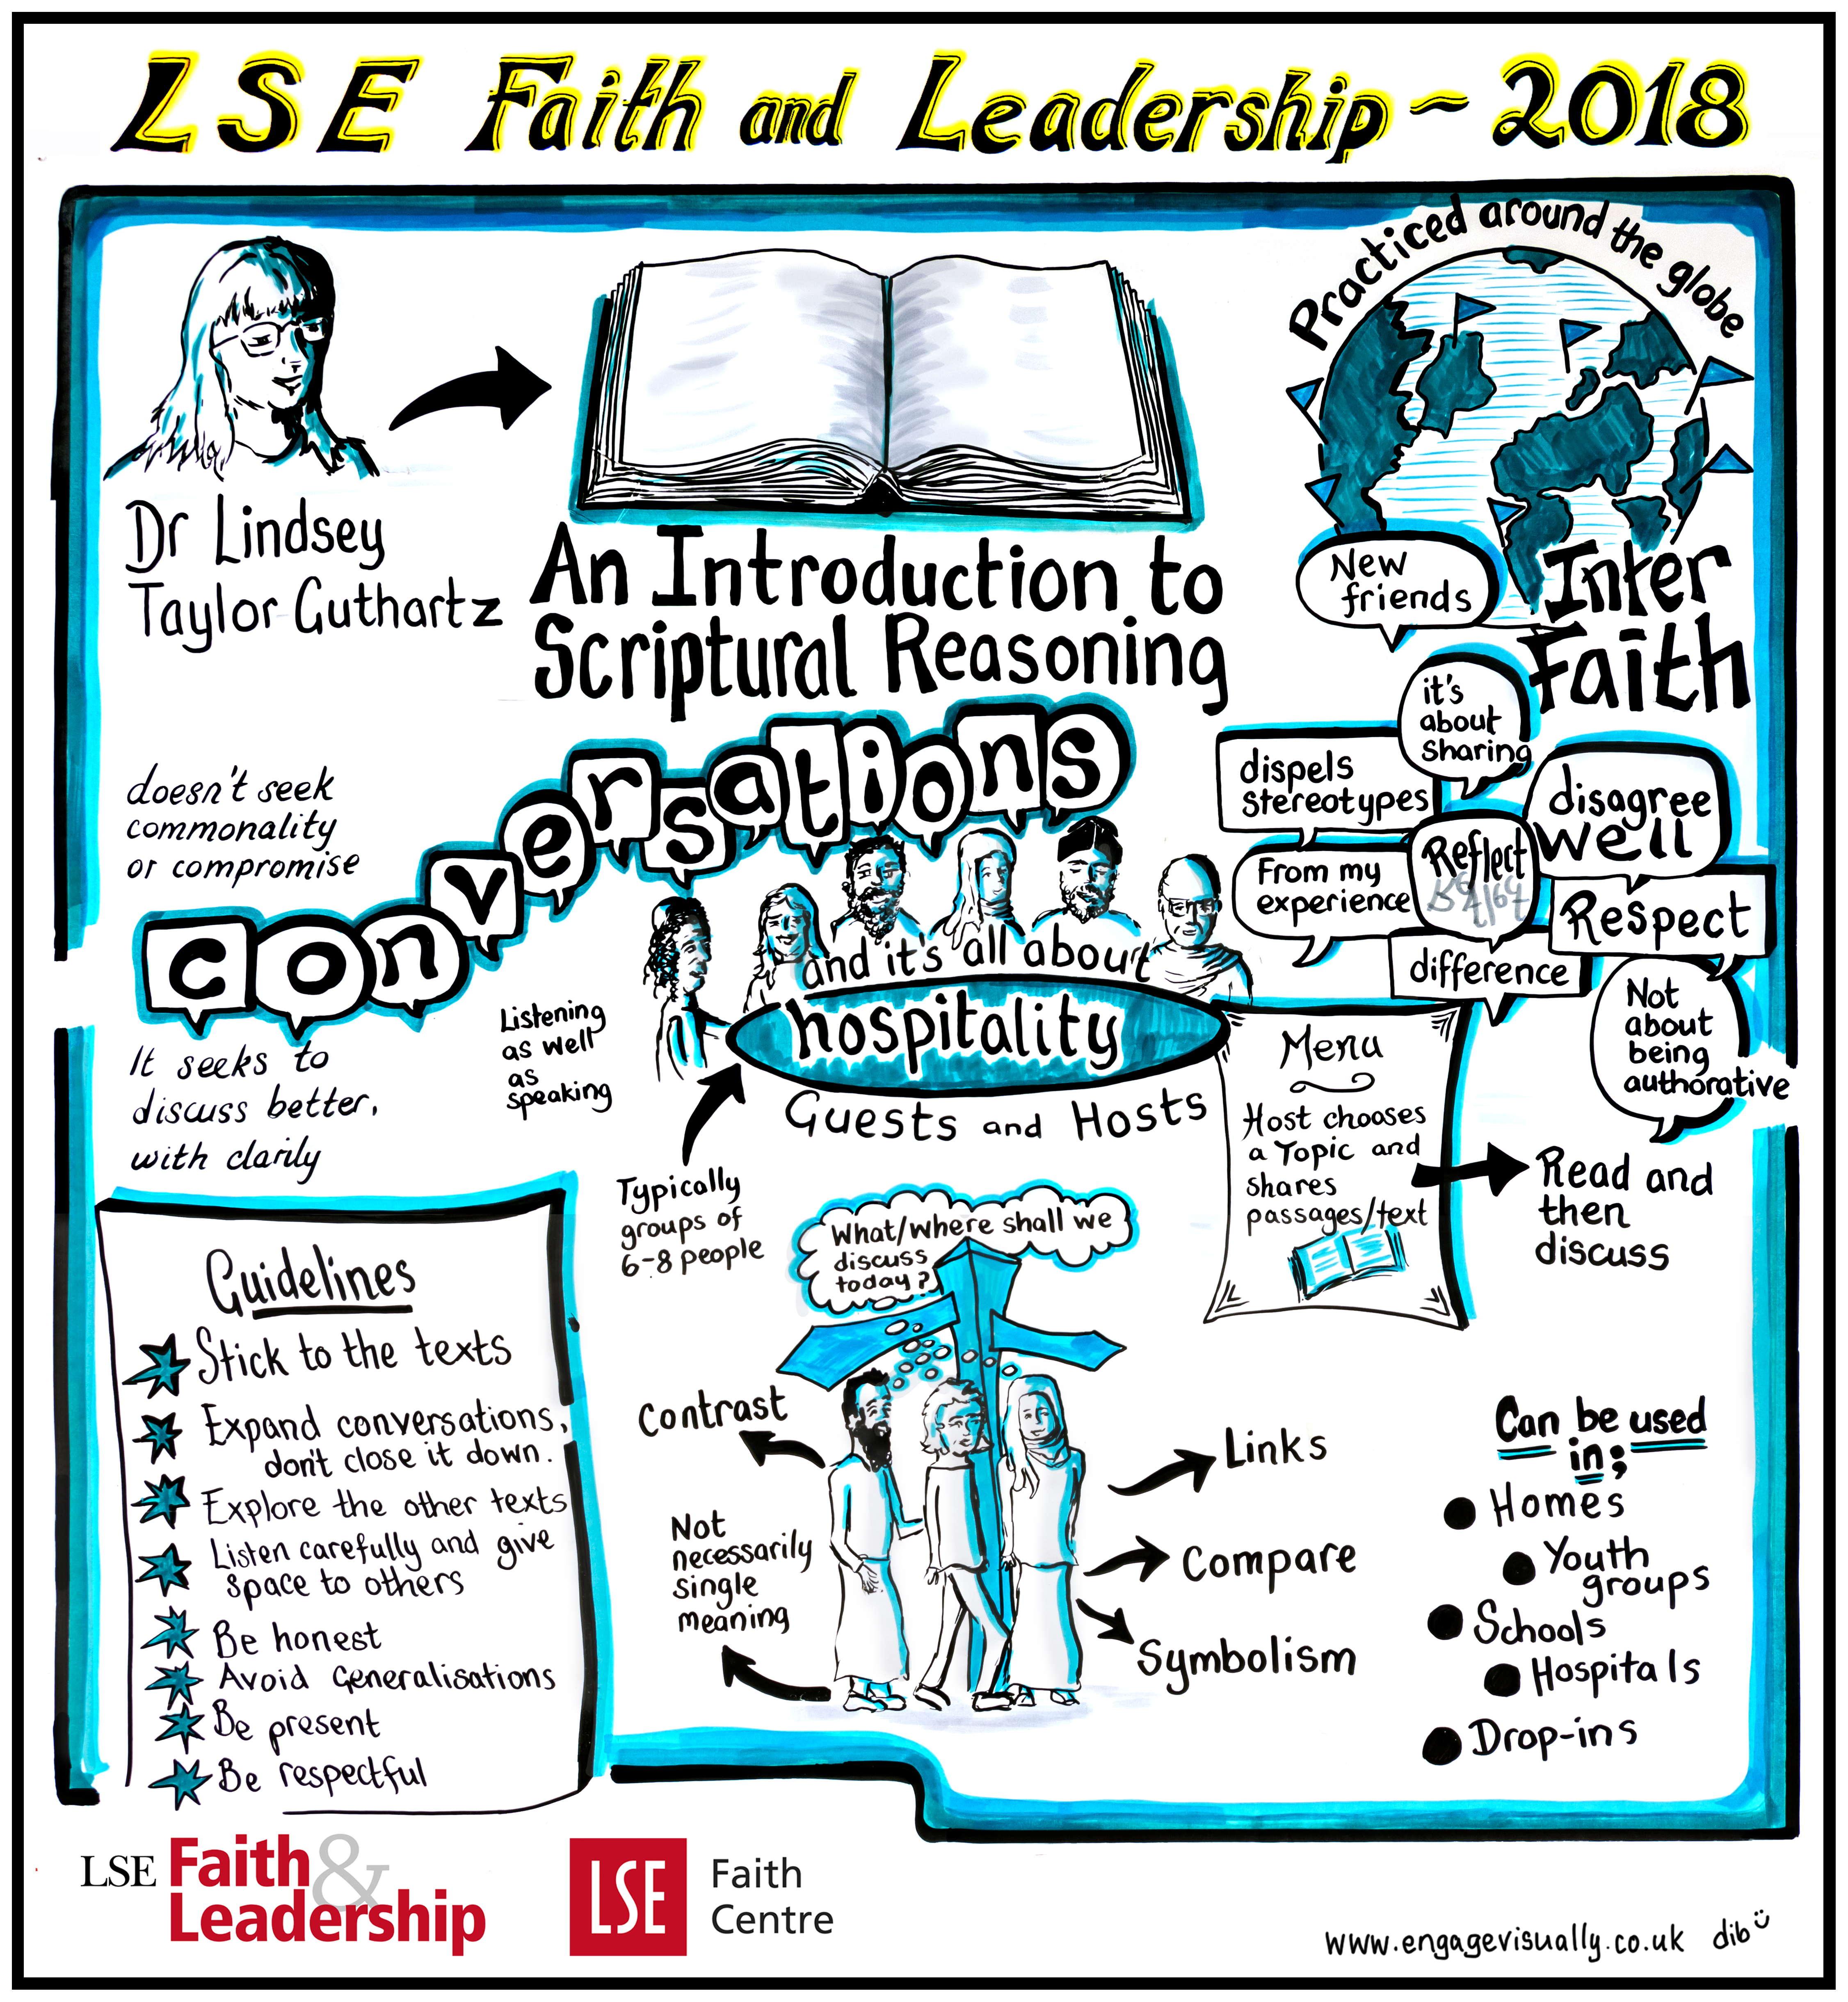
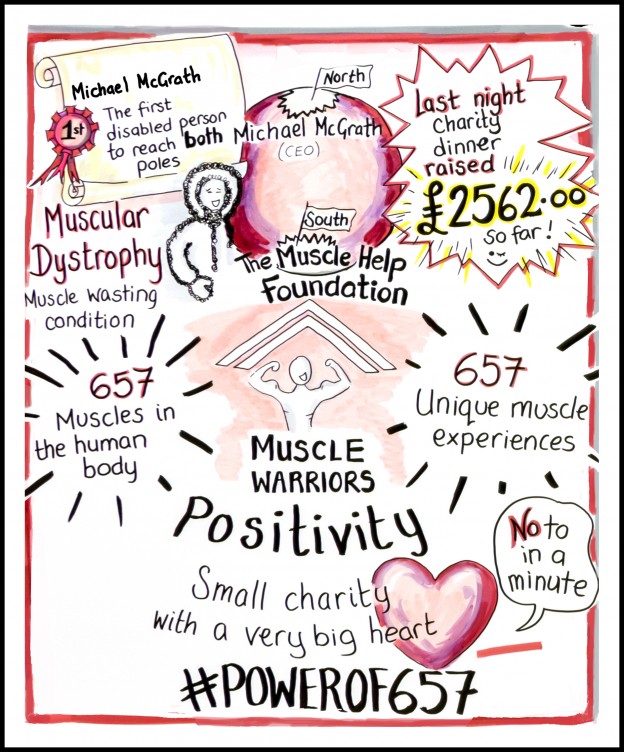
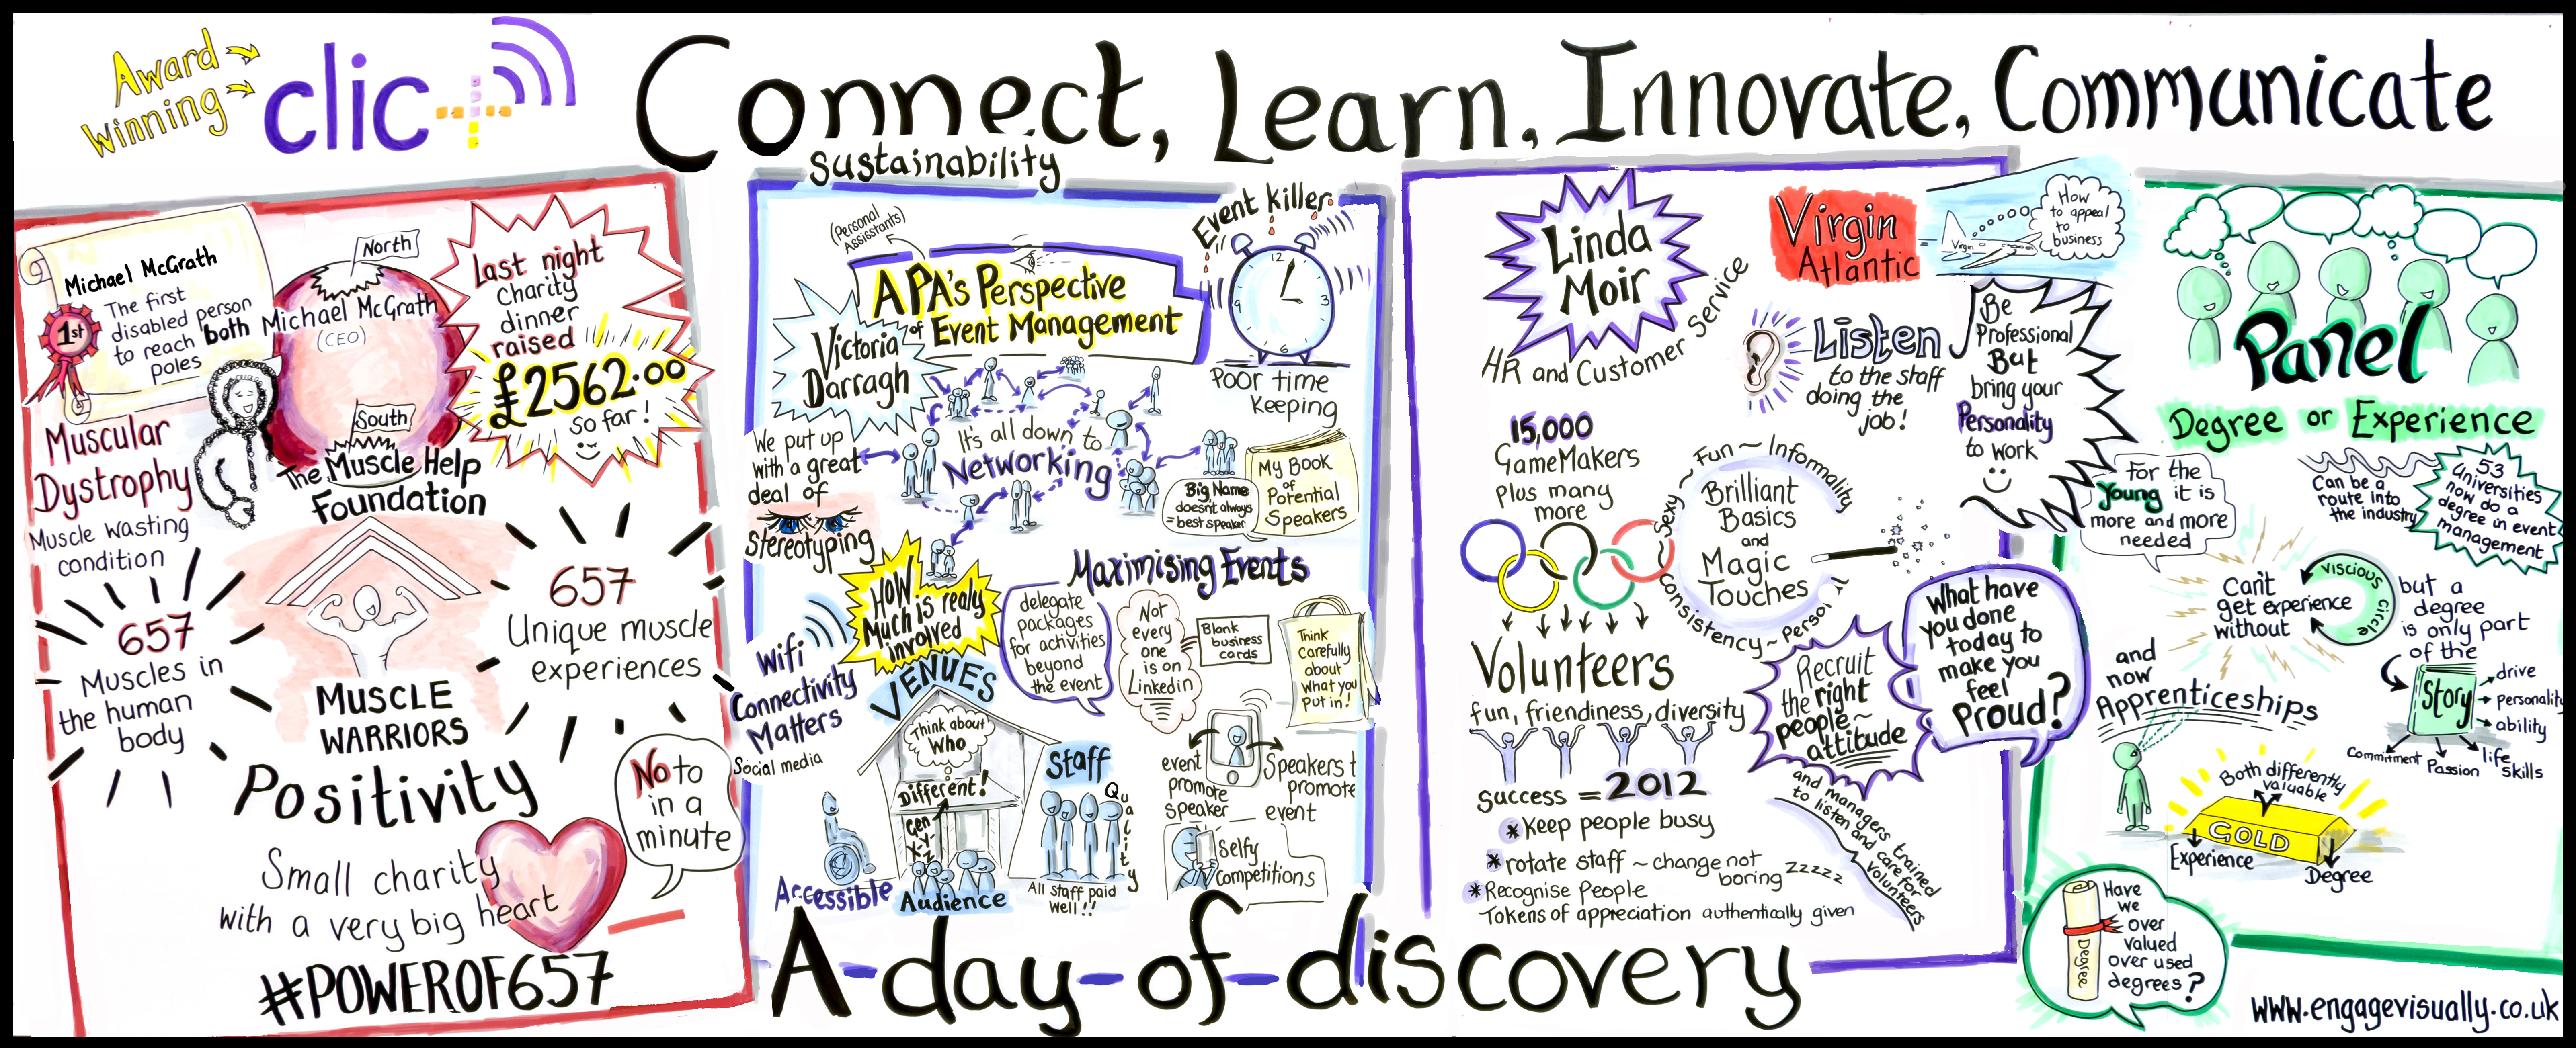
N.b Sketchnotes by Debbie Roberts at Engage Visually, all other images are by various creative hands at the conference.


